
Investing
Gravestone Doji on NIFTY – Bearish Signal or Just Noise?

FabTrader
Article overview
September has drawn to a close, and on the monthly chart of NIFTY, traders and analysts are noticing something interesting: the appearance of a gravestone doji. For seasoned chart watchers, this candle often sparks debate and analysis, as it represents an intense tug-of-war between buyers and sellers. But for...
September has drawn to a close, and on the monthly chart of NIFTY, traders and analysts are noticing something interesting: the appearance of a gravestone doji. For seasoned chart watchers, this candle often sparks debate and analysis, as it represents an intense tug-of-war between buyers and sellers. But for beginners, spotting such a pattern can raise far more questions than answers.
What exactly is a gravestone doji? Does it really mean the market is about to collapse? And how does it differ from its cousin, the dragonfly doji?
In this article, we’ll break it down in simple terms. The goal here is not to forecast the market but to educate new traders and investors about this important candlestick formation, the psychology behind it, and how to approach it with the right mindset.
What is a Gravestone Doji?
The gravestone doji is a single-candle candlestick pattern that looks like an upside-down letter “T.” It forms when the open, low, and close of a trading session (or month, if we’re looking at monthly charts) are roughly the same, while prices shoot higher during the period but then fall back down to close near the lows.
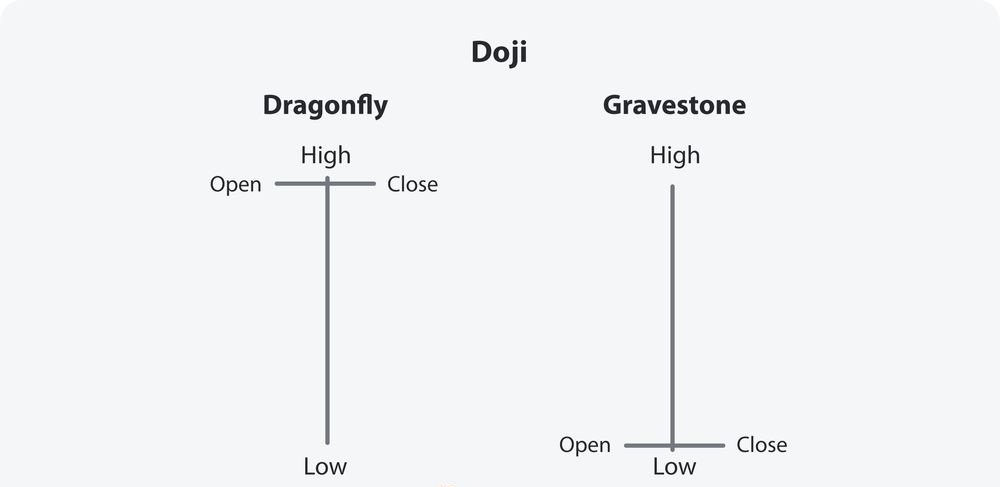
Here’s what this pattern tells us:
- Buyers managed to push the price significantly higher.
- Sellers then stepped in aggressively, erasing all of those gains.
- By the end of the session, the market closed almost exactly where it began.
The imagery is fitting—like a gravestone marking the end of bullish momentum. It visually represents failed buying pressure and potential exhaustion on the upside.
What Does It Usually Signify?
This is where many beginners get it wrong. A gravestone doji does not automatically mean the market will reverse and enter a bearish trend. Instead, it signals potential weakness or a shift in sentiment. Confirmation is crucial.
Two conditions, in particular, make a gravestone doji more meaningful:
- Volume confirmation:
If the doji forms on unusually high bullish volume—meaning there was a strong push to lift prices—that adds weight to the signal. Sellers overpowering such heavy buying activity is a stronger indication of resistance than if the candle formed on low, average volumes. - Next candle confirmation:
This is the non-negotiable part. A single candlestick pattern is rarely enough to dictate the next trend. Traders usually wait for the next candle to close below the doji’s close before treating it as bearish confirmation. Without this follow-up, the gravestone could just be noise in the broader trend.
In other words, a gravestone doji is like a yellow traffic light—it tells you to be cautious, but it doesn’t mean the road ahead is closed.
Gravestone Doji vs. Dragonfly Doji
To truly understand the gravestone doji, it helps to compare it with its opposite: the dragonfly doji.
- Gravestone Doji:
Appears when buyers fail to hold onto gains, leaving behind a long upper shadow. This often hints at bearish sentiment or resistance. - Dragonfly Doji:
Appears when sellers drive the price lower during the session, but buyers push it back up to close near the open. The result is a long lower shadow, shaped like a regular “T.” This can suggest bullish sentiment or support.
Think of them as mirror images—gravestone marks failed rallies, dragonfly marks failed selloffs. Both reflect market indecision and both require confirmation before they can be trusted.
Context: NIFTY’s Range-Bound Year
Looking at the NIFTY index, the context is important. From the end of September 2024 up to now, the index has been frustratingly range-bound, delivering a roughly –5% change over the past year. For active traders, this has been a tough environment with few clear trends. For options writers, however, it’s been a relatively rewarding period, since range-bound markets tend to favor strategies that profit from time decay.
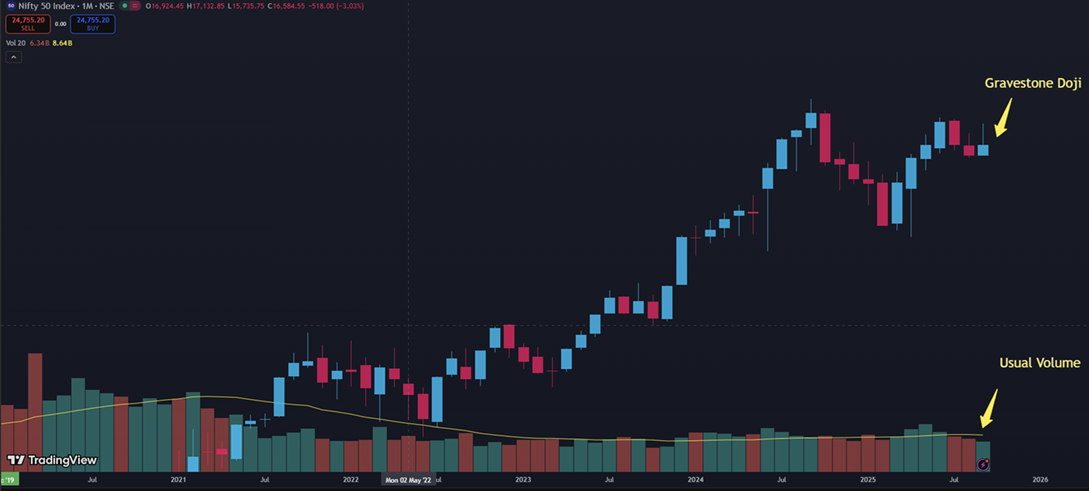
Now, with September closing on what looks like a gravestone doji, some traders may jump to conclusions that the next leg is surely bearish. But remember the rules:
- Volumes for September have been in line with the averages. This further strengthens the fact that in spite of bulls pushing through, the price has stayed flat.
- Confirmation from the October candle is still pending. This is going to be crucial and might help confirm if Nifty would take a bearish dive by end of October.
So, while the gravestone doji deserves attention, it is not—on its own—a call for panic or excitement. October’s candle will be critical in revealing whether this pattern carries weight or if it’s just another marker in the tug-of-war between bulls and bears.
Why Context Matters
Technical patterns don’t exist in a vacuum. They must be viewed in the broader backdrop.
Right now, there are global uncertainties weighing on sentiment—trade pressures, rising tariffs, and layoffs in India’s IT sector, to name a few. At the same time, India’s domestic economy continues to show resilience, with optimism around festive demand, consumption, and long-term structural growth.
For short-term traders, especially options traders, the right approach is to stay cautious. Protect positions, use hedges, and avoid getting overly confident based on a single candlestick. For long-term investors, this might actually be a time to gradually add quality stocks. India remains one of the most attractive growth stories globally, even if short-term turbulence continues.
A Practical Check: Detecting Gravestone Doji with Python
For readers who are comfortable with a bit of coding, it’s possible to programmatically detect a gravestone doji using monthly candlestick data. With Python, libraries like yfinance and pandas allow you to fetch market data and check if the latest candle fits the gravestone doji criteria.
Here’s a simple script you can try out:
import yfinance as yf

def is_gravestone_doji(open_price, high, low, close, tolerance=0.002):
    """
    Gravestone Doji check:
    - Small body (open ≈ close)
    - Lower shadow very small (low ≈ min(open, close))
    - Long upper shadow
    """
    body = abs(close - open_price)
    candle_range = high - low

    if candle_range == 0:
        return False

    # Small body relative to range
    small_body = 2 * body <= candle_range

    # Lower shadow very small
    lower_shadow = min(open_price, close) - low
    small_lower_shadow = lower_shadow <= tolerance * candle_range

    # Upper shadow is long (at least 2x the body)
    upper_shadow = high - max(open_price, close)
    long_upper_shadow = upper_shadow >= 2 * body

    return small_body and small_lower_shadow and long_upper_shadow

# Example: NIFTY (^NSEI on Yahoo Finance)
ticker = "^NSEI"  # NIFTY 50 index
data = yf.download(ticker, period="2y", interval="1mo", multi_level_index=False, progress=False, auto_adjust=True)

# Drop rows with incomplete data
data = data.dropna()

# Get latest monthly candle
latest = data.iloc[-1]
open = data['Open'].iloc[-1]
close = data['Close'].iloc[-1]
high = data['High'].iloc[-1]
low = data['Low'].iloc[-1]

print("Latest Monthly Candle:")
print("Open : ", open)
print("Close : ", close)
print("High : ", high)
print("Low : ", low)

if is_gravestone_doji(open, high, low, close):
    print("The latest monthly candle is a Gravestone Doji 📉")
else:
    print("The latest monthly candle is NOT a Gravestone Doji.")
Final Word
The gravestone doji is a fascinating candlestick because it compresses so much market psychology into one candle. It tells the story of a failed rally, where buyers lost control and sellers reasserted themselves. But the biggest lesson for beginners is this: no candlestick should be used in isolation.
A gravestone doji is not a crystal ball—it’s a clue. Confirmation from volume, the next candle, and the broader context is essential before drawing conclusions.
So while NIFTY may have flashed a gravestone doji on the monthly chart, the next few weeks will tell us whether it truly marks a shift in sentiment or just another hesitation in a range-bound market.
This article is not a prediction. It’s an educational exploration of an important candlestick pattern. Trading and investing are about managing risk, keeping perspective, and staying disciplined. Stay cautious, stay curious, and above all—stay positive.
More from Investing
Is the Stock Market Quietly Killing Human Creativity and productivity?
For centuries, human progress has been driven by people who built things—engineers, scientists, entrepreneurs, artists and inventors. But as financial markets become...
Beyond Returns: Why I Built a More Intelligent Midcap Mutual Fund Screener
Looking for the best midcap mutual funds in India? This article explains how our Midcap Mutual Fund Screener goes beyond traditional return-based...
How to Build a robust Passive Index Investing System that works
Passive investing has transformed the way investors build wealth. But with so many choices—from Nifty 50 Index Funds and Nifty Next 50...