Investing
A Simple, Peaceful ETF Rotation Strategy That Delivered 32% CAGR

FabTrader
Article overview
Markets are constantly shifting leadership between sectors, asset classes, and global markets. Instead of trying to predict where the next opportunity might appear, this strategy takes a different approach — it simply follows strength. By rotating capital each month into the strongest performing ETFs across equities, commodities, and global markets, this simple momentum-based system produced a CAGR of around 32% over the last four years in backtests. In this article, I’ll walk you through the idea behind the strategy, how it works, and share the backtest code so you can experiment with it yourself.
One of the most common questions investors struggle with is surprisingly simple.
Where should I invest right now?
Should it be NIFTY 50?
Bank Nifty?
Gold?
Silver?
Nasdaq?
Or maybe a fast-moving sector like IT or Defence?
Every week there’s a new narrative in the market. One week it’s commodities, the next week it’s banking stocks, and suddenly everyone is talking about global tech again. Trying to predict which asset class will outperform next can feel like chasing shadows. So instead of trying to predict the future, I wanted to test a different approach.
What if we simply let the market itself tell us where the strength is, and allocate our capital accordingly? That idea led me to build and backtest a simple ETF rotation strategy that dynamically shifts capital toward the strongest performing ETFs each month. The results turned out to be surprisingly strong.
The Core Idea Behind the Strategy
At its heart, this strategy is based on a well-known concept in financial markets called momentum.
Momentum simply means that assets that have been performing well recently tend to continue performing well for some time. It’s one of the most widely researched phenomena in market behavior and has been studied across equities, commodities, currencies and even global asset classes.
Instead of making predictions about where the market might go, the strategy simply observes which assets are already showing strength and allocates capital to them. Every month the strategy looks at a basket of ETFs across different asset classes and sectors. It measures their recent performance, ranks them, and then invests in the top performers for the coming month. At the end of the month, the portfolio is reset and the process repeats again. In essence, the strategy continuously rotates capital toward the strongest areas of the market.
The ETF Universe
To make this experiment meaningful, I wanted to include ETFs representing a variety of different market segments.
For the broad market exposure, NIFTY 50 and Bank Nifty, global markets Nasdaq 100 and Hang Seng, for commodities Gold and Silver ETFs, and all sector ETFs like IT, Pharma, Infrastructure and Defence were also included.
For each category, I selected the most liquid ETF available, under each category ensuring that the strategy remains practical and tradable.
ETFs Considered : 'SILVERBEES', 'NIFTYBEES', 'GOLDBEES', 'BANKBEES', 'JUNIORBEES', 'HDFCSML250', 'MID150BEES', 'ITBEES', 'PSUBNKBEES', 'MODEFENCE', 'MOM30IETF', 'MON100', 'ENERGY', 'METALIETF', 'PHARMABEES', 'PVTBANIETF', 'AUTOBEES', 'FMCGIETF', 'MONIFTY500', 'ALPL30IETF', 'MIDSMALL', 'HNGSNGBEES', 'SENSEXIETF', 'MOREALTY', 'OILIETF', 'GROWWPOWER', 'CONSUMBEES', 'INFRABEES', 'HEALTHIETF', 'EVINDIA', 'CHEMICAL', 'MAKEINDIA', 'MOTOUR', 'MNC', 'ESG', 'ECAPINSURE', 'MSCIINDIA'
This creates a portfolio universe where capital can rotate between equities, commodities, global markets and sectors depending on where the strength emerges.
How the Strategy Works
The strategy follows a simple, rules-based process that is executed once every month. The goal is to systematically allocate capital to the strongest ETFs while avoiding those in weak trends. Below are the exact rules used in the backtest.
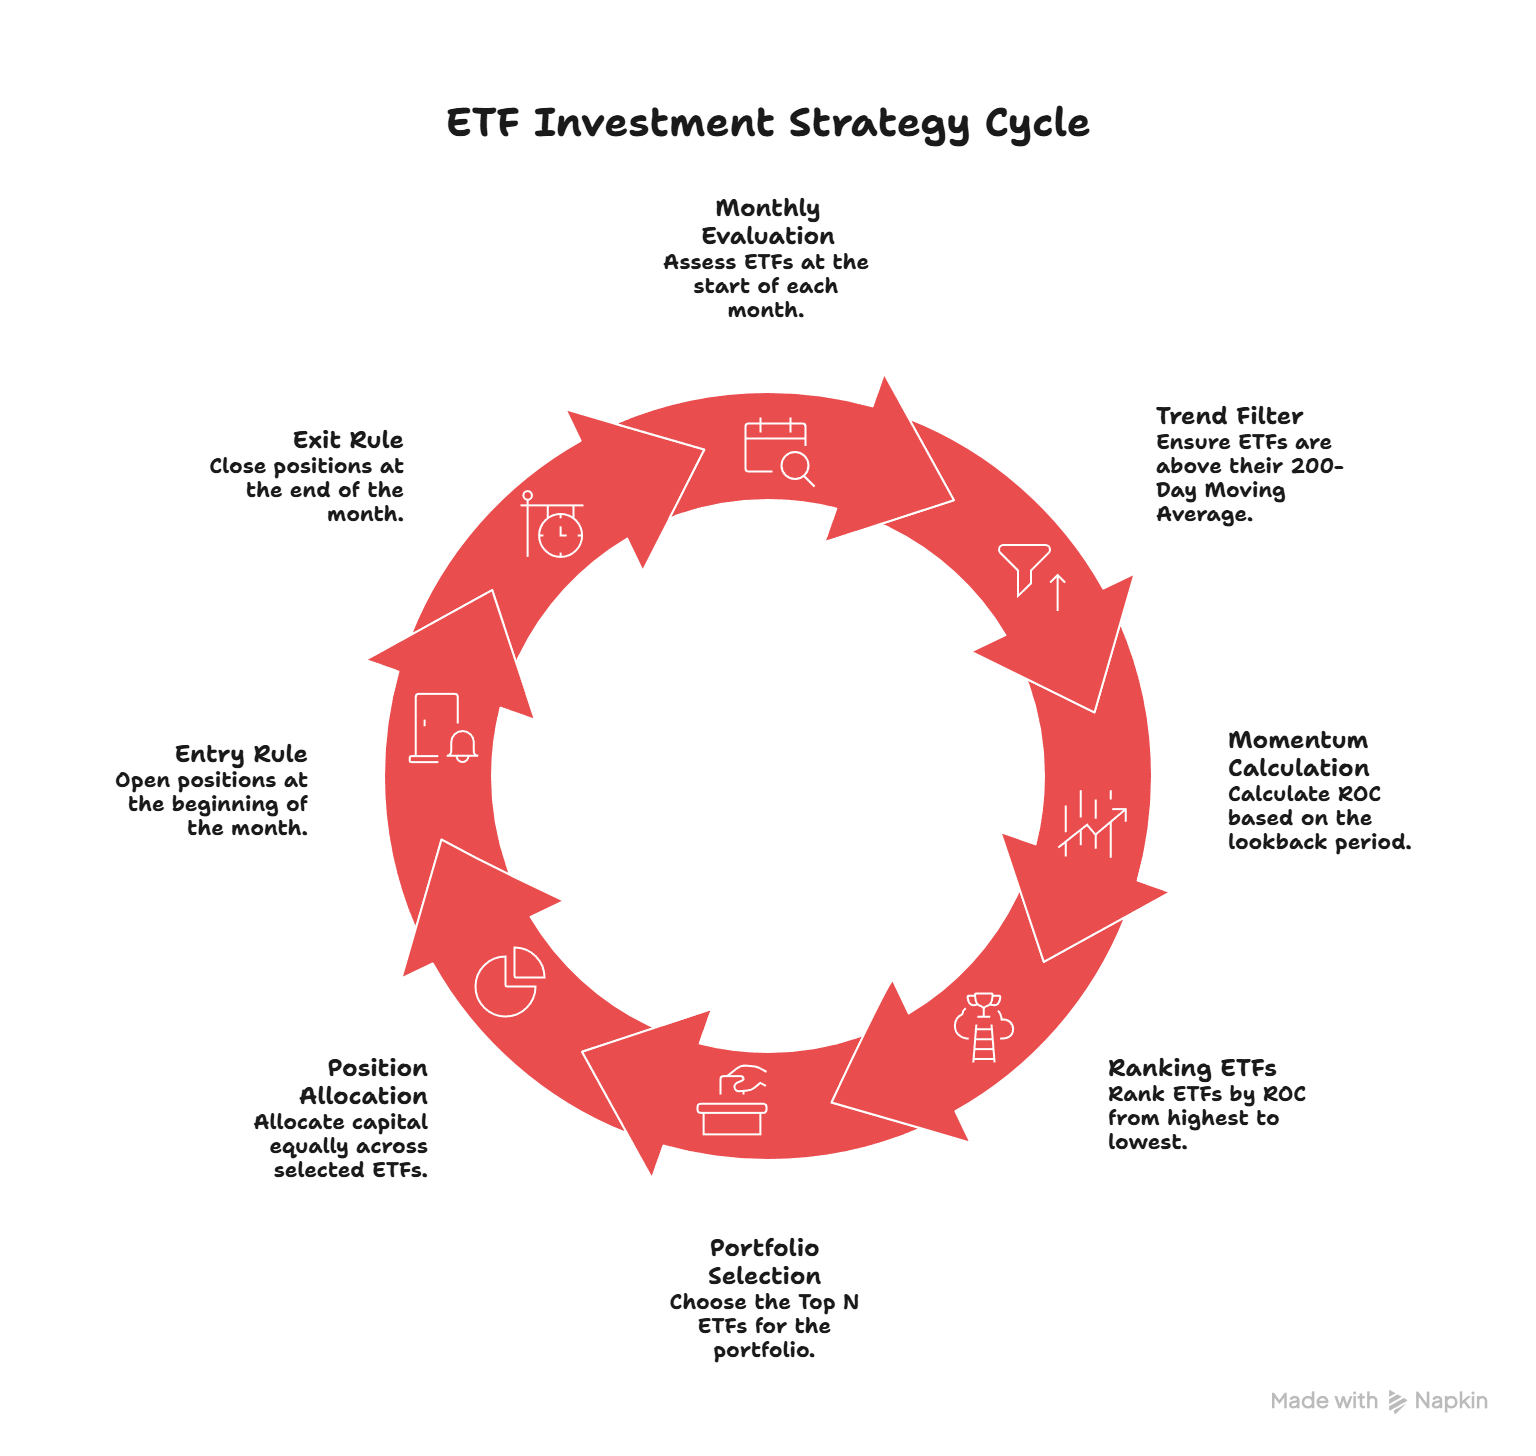
1. Monthly Evaluation
At the start of every month, the strategy evaluates all ETFs in the universe.
All trades are executed on a monthly timeframe, which keeps trading frequency low and makes the approach suitable for positional investors.
2. Trend Filter
Before an ETF can be considered for the portfolio, it must satisfy a simple long-term trend condition:
- The ETF’s price must be above its 200-Day Moving Average
This filter helps avoid assets that are in long-term downtrends and ensures that the strategy focuses only on ETFs that are already showing structural strength.
3. Momentum Calculation
For all ETFs that pass the trend filter:
- Calculate the Rate of Change (ROC) based on the chosen lookback period
- The lookback period is parameterized and can be adjusted
Examples include:
- 1 Month ROC
- 2 Month ROC
- 3 Month ROC
This metric measures how strongly each ETF has performed recently.
4. Ranking ETFs
Once momentum is calculated:
- All eligible ETFs are ranked from highest ROC to lowest ROC
The ETFs at the top of the ranking are considered the strongest performers in the market at that moment.
5. Portfolio Selection
From the ranked list:
- Select the Top N ETFs
The number of ETFs included in the portfolio is configurable. Examples include:
- Top 3 ETFs
- Top 4 ETFs
- Top 5 ETFs
This parameter is also adjustable in the backtest code, allowing readers to experiment with different portfolio sizes.
6. Position Allocation
Capital is allocated equally across the selected ETFs.
For example:
- If 3 ETFs are selected → each receives ~33% allocation
- If 4 ETFs are selected → each receives 25% allocation
This keeps the portfolio balanced and avoids overconcentration.
7. Entry Rule
Positions are opened:
- At the beginning of the month
- Using the monthly opening price
8. Exit Rule
All positions are closed:
- At the end of the same month
- Using the monthly closing price
At the start of the next month, the strategy repeats the entire process again with fresh momentum rankings.
Strategy Flexibility
One of the things I wanted to explore while building this strategy was how sensitive the results are to different parameters.
Two parameters were therefore made configurable in the backtest code.
The first is the momentum lookback period used to calculate the Rate of Change. While a one-month ROC works well in some cases, longer lookback periods such as two or three months may produce different results.
The second parameter is the number of ETFs selected for the portfolio each month. Instead of always picking a fixed number like three, the strategy can also be tested with four, five or even more ETFs.
I have experimented with a few combinations, but I haven’t run a full parameter optimization across all possibilities. That’s something readers can explore themselves using the backtest code.
Backtest Results
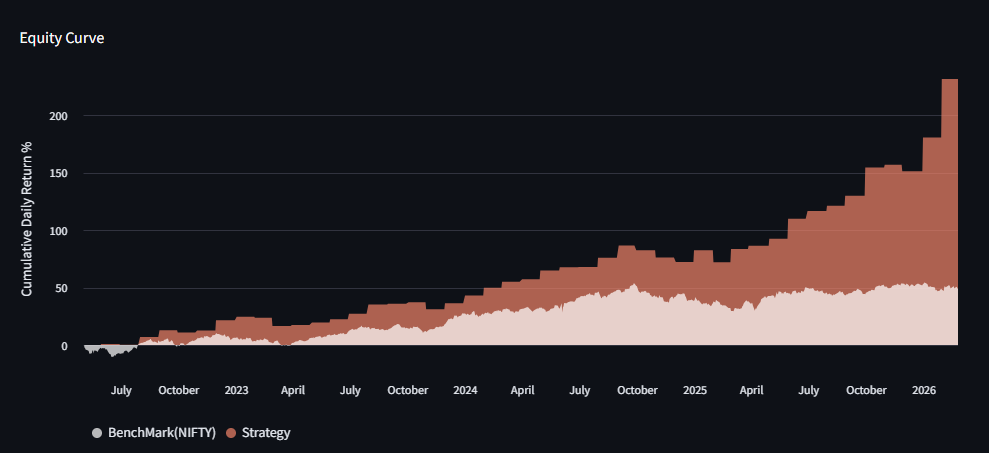
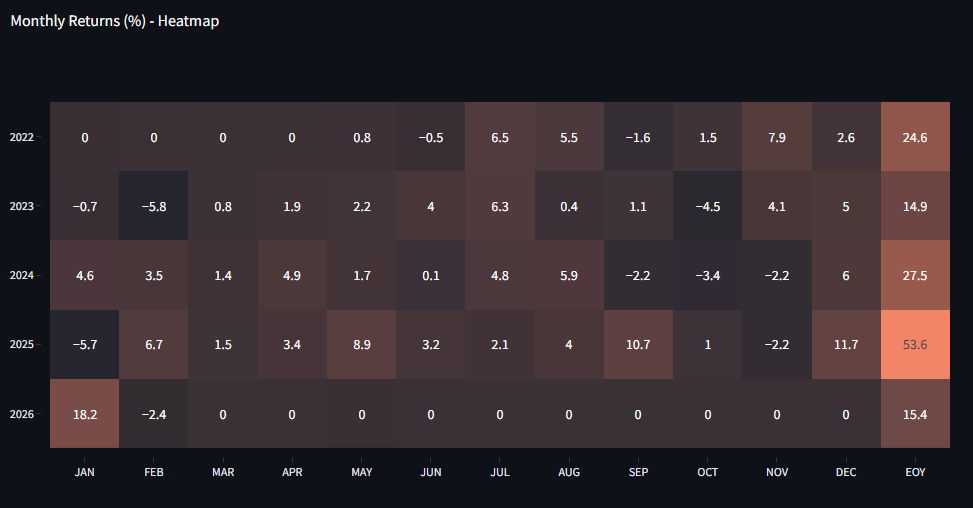
While testing different parameter combinations, one particular configuration produced results that immediately caught my attention. Over the last four years, the strategy delivered a CAGR of roughly 32%. For a relatively simple monthly rotation strategy, that’s quite remarkable.
What makes it even more interesting is that the strategy maintained strong performance even during periods when markets were not particularly friendly. For instance, in a difficult year like 2024, the strategy still managed to generate a return of around 27.5%, which is significantly higher than what many traditional strategies achieved during the same period.
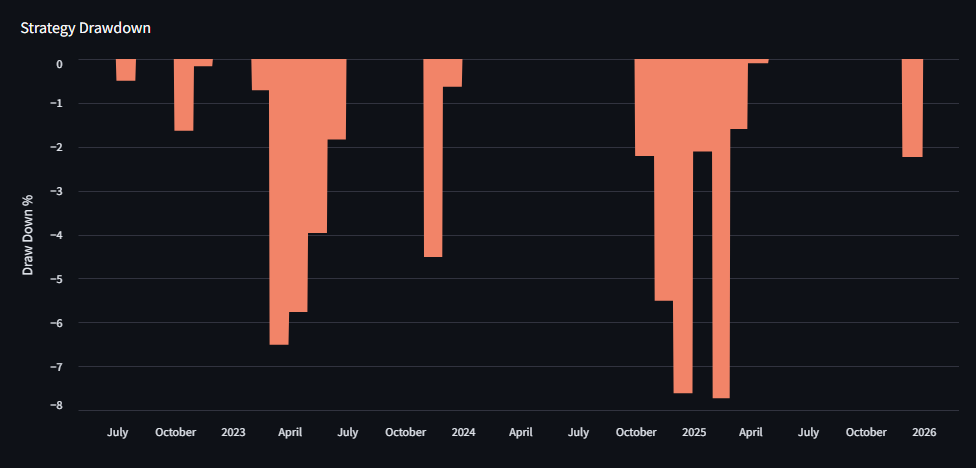
Of course, a single number never tells the full story. That’s why I’m attaching the complete backtest report along with this article, including the equity curve, drawdown charts, and underwater plots so you can examine how the strategy behaved through time.
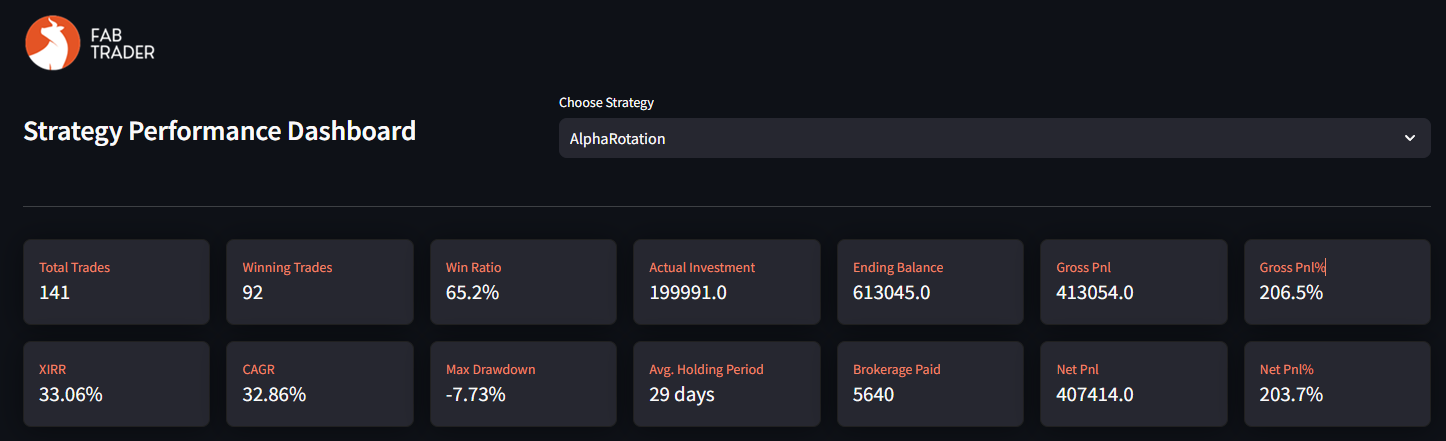
----- Backtest Summary -----
Strategy Name : AlphaRotation
Strategy Start Date / First Trade Entry Date :  2022-04-01 00:00:00
Strategy End Date / Last Trade Exit Date :  2026-02-27 00:00:00

----- Strategy Performance -----
Starting Balance         : 200000
Ending Balance           : 607414.52
Total Net PnL            : 407414.52
Total Net PnL %          : 203.71
CAGR                     : 32.86
Max Drawdown (%)         : -4.35
Max Drawdown (Amount)    : -27072.22
Number of Trades         : 141
Win Rate (%)             : 65.25
Average Win (%)          : 6.24
Average Loss (%)         : -4.41
Average Win Amount       : 6951.27
Average Loss Amount      : -4736.79
Risk/Reward Ratio        : 1.42
Sharpe Ratio             : 2.02
Sortino Ratio            : 5.09
What You’ll Get If You Want to Test It Yourself
For those who want to dig deeper, I’ve put together a complete package that includes:
- ✅The full Python backtesting code
- ✅10 years of daily OHLC data for 37 ETFs
- ✅A complete tradebook covering every trade
- ✅A detailed performance metrics report
You can run the tests yourself, tweak parameters, optimize for better returns and lower drawdown or use the code as a starting point for your own research. You can access this backtest package here
How I Backtested This
I have a full-fledged backtesting framework in Python, built to test trading strategies with precision.
This is the same framework I teach in my course: Backtesting Trading Strategies using AI and Python. If you want to learn how to build such backtesters, test strategies like this one, and validate them with real numbers, you can check out the course here: [Link to Course].
And if you’re someone who wants to go one step further – not just test strategies but actually deploy them in real markets in full auto mode – I also run a course on Building a Complete Algo Trading System in Python.
In that program, I cover how to:
- ✅Automate your strategies from end to end.
- ✅Run them on an AWS server 24/7.
- ✅Implement risk and money management.
- ✅Build a real-time monitoring dashboard.
- ✅Even manage trades from a Telegram bot.
Basically, it’s everything you need to go from a backtested strategy to a production-grade automated system. You can learn more about that here: [Link to Course].
Why This Approach Can Work
Markets tend to move in cycles of leadership.
Sometimes commodities dominate. At other times, technology stocks lead the rally. In certain phases, banking stocks take charge of the market, while in others, defensive sectors like pharma start outperforming.
Trying to predict these shifts in advance is extremely difficult. But momentum strategies don’t try to predict them. Instead, they simply observe where the strength already exists and move capital accordingly.
If gold starts trending strongly, the strategy will naturally rotate toward gold ETFs. If technology stocks begin leading the market, the momentum ranking will push IT or Nasdaq ETFs to the top. Over time, this dynamic allocation helps the portfolio stay aligned with the strongest trends in the market.
A Quick Word of Caution
Also, while I have tested several parameter combinations, this is by no means an exhaustive analysis. There are many variations that could be explored further. The purpose of sharing this strategy is not to present a “perfect system”, but rather to demonstrate how simple systematic rules can produce surprisingly strong results.
Final Thoughts
Sometimes the most effective strategies are not the most complicated ones.
This approach relies on just a few simple concepts — trend, momentum and periodic rebalancing. Yet when applied consistently, these principles can produce surprisingly powerful outcomes.
The market is constantly shifting its leadership between asset classes and sectors. A rotation strategy like this simply accepts that reality and adapts to it.
Instead of asking “What should I buy?”, the strategy asks a different question:
“Where is the market already showing strength?”
And then it follows that strength.
More from Investing
Beyond Returns: Why I Built a More Intelligent Midcap Mutual Fund Screener
Looking for the best midcap mutual funds in India? This article explains how our Midcap Mutual Fund Screener goes beyond traditional return-based...
How to Build a robust Passive Index Investing System that works
Passive investing has transformed the way investors build wealth. But with so many choices—from Nifty 50 Index Funds and Nifty Next 50...
How to build a low risk dividend portfolio for early retirement
As I get closer to early retirement, my approach to investing has quietly evolved. Growth still matters, but reliability matters more. Instead...