
Investing
Beyond Returns: Why I Built a More Intelligent Midcap Mutual Fund Screener

FabTrader
Article overview
Looking for the best midcap mutual funds in India? This article explains how our Midcap Mutual Fund Screener goes beyond traditional return-based rankings by analyzing rolling returns, upside capture, downside capture, Sortino ratio, drawdowns, recovery periods, expense ratios, and consistency metrics. Discover how a more comprehensive mutual fund analysis framework can help investors identify high-quality midcap funds with stronger risk-adjusted performance across market cycles.
Choosing a midcap mutual fund is not as straightforward as sorting a list by recent returns.
Most investors compare funds using metrics like 1-year returns, 3-year CAGR, star ratings, AUM, or expense ratios. While these numbers are useful, they often tell only part of the story.
A fund can look exceptional during one market phase and appear average during another. Some funds generate strong returns but expose investors to deep drawdowns. Others may lag slightly during bull markets but offer much better downside protection and consistency.
That is exactly why I built this Midcap Mutual Fund Screener. The goal was not to create another return-ranking table. The goal was to build a framework that evaluates how a fund behaves across different market environments and not just how much return it delivered during a particular period.
The Core Philosophy
The central idea behind this screener is simple:
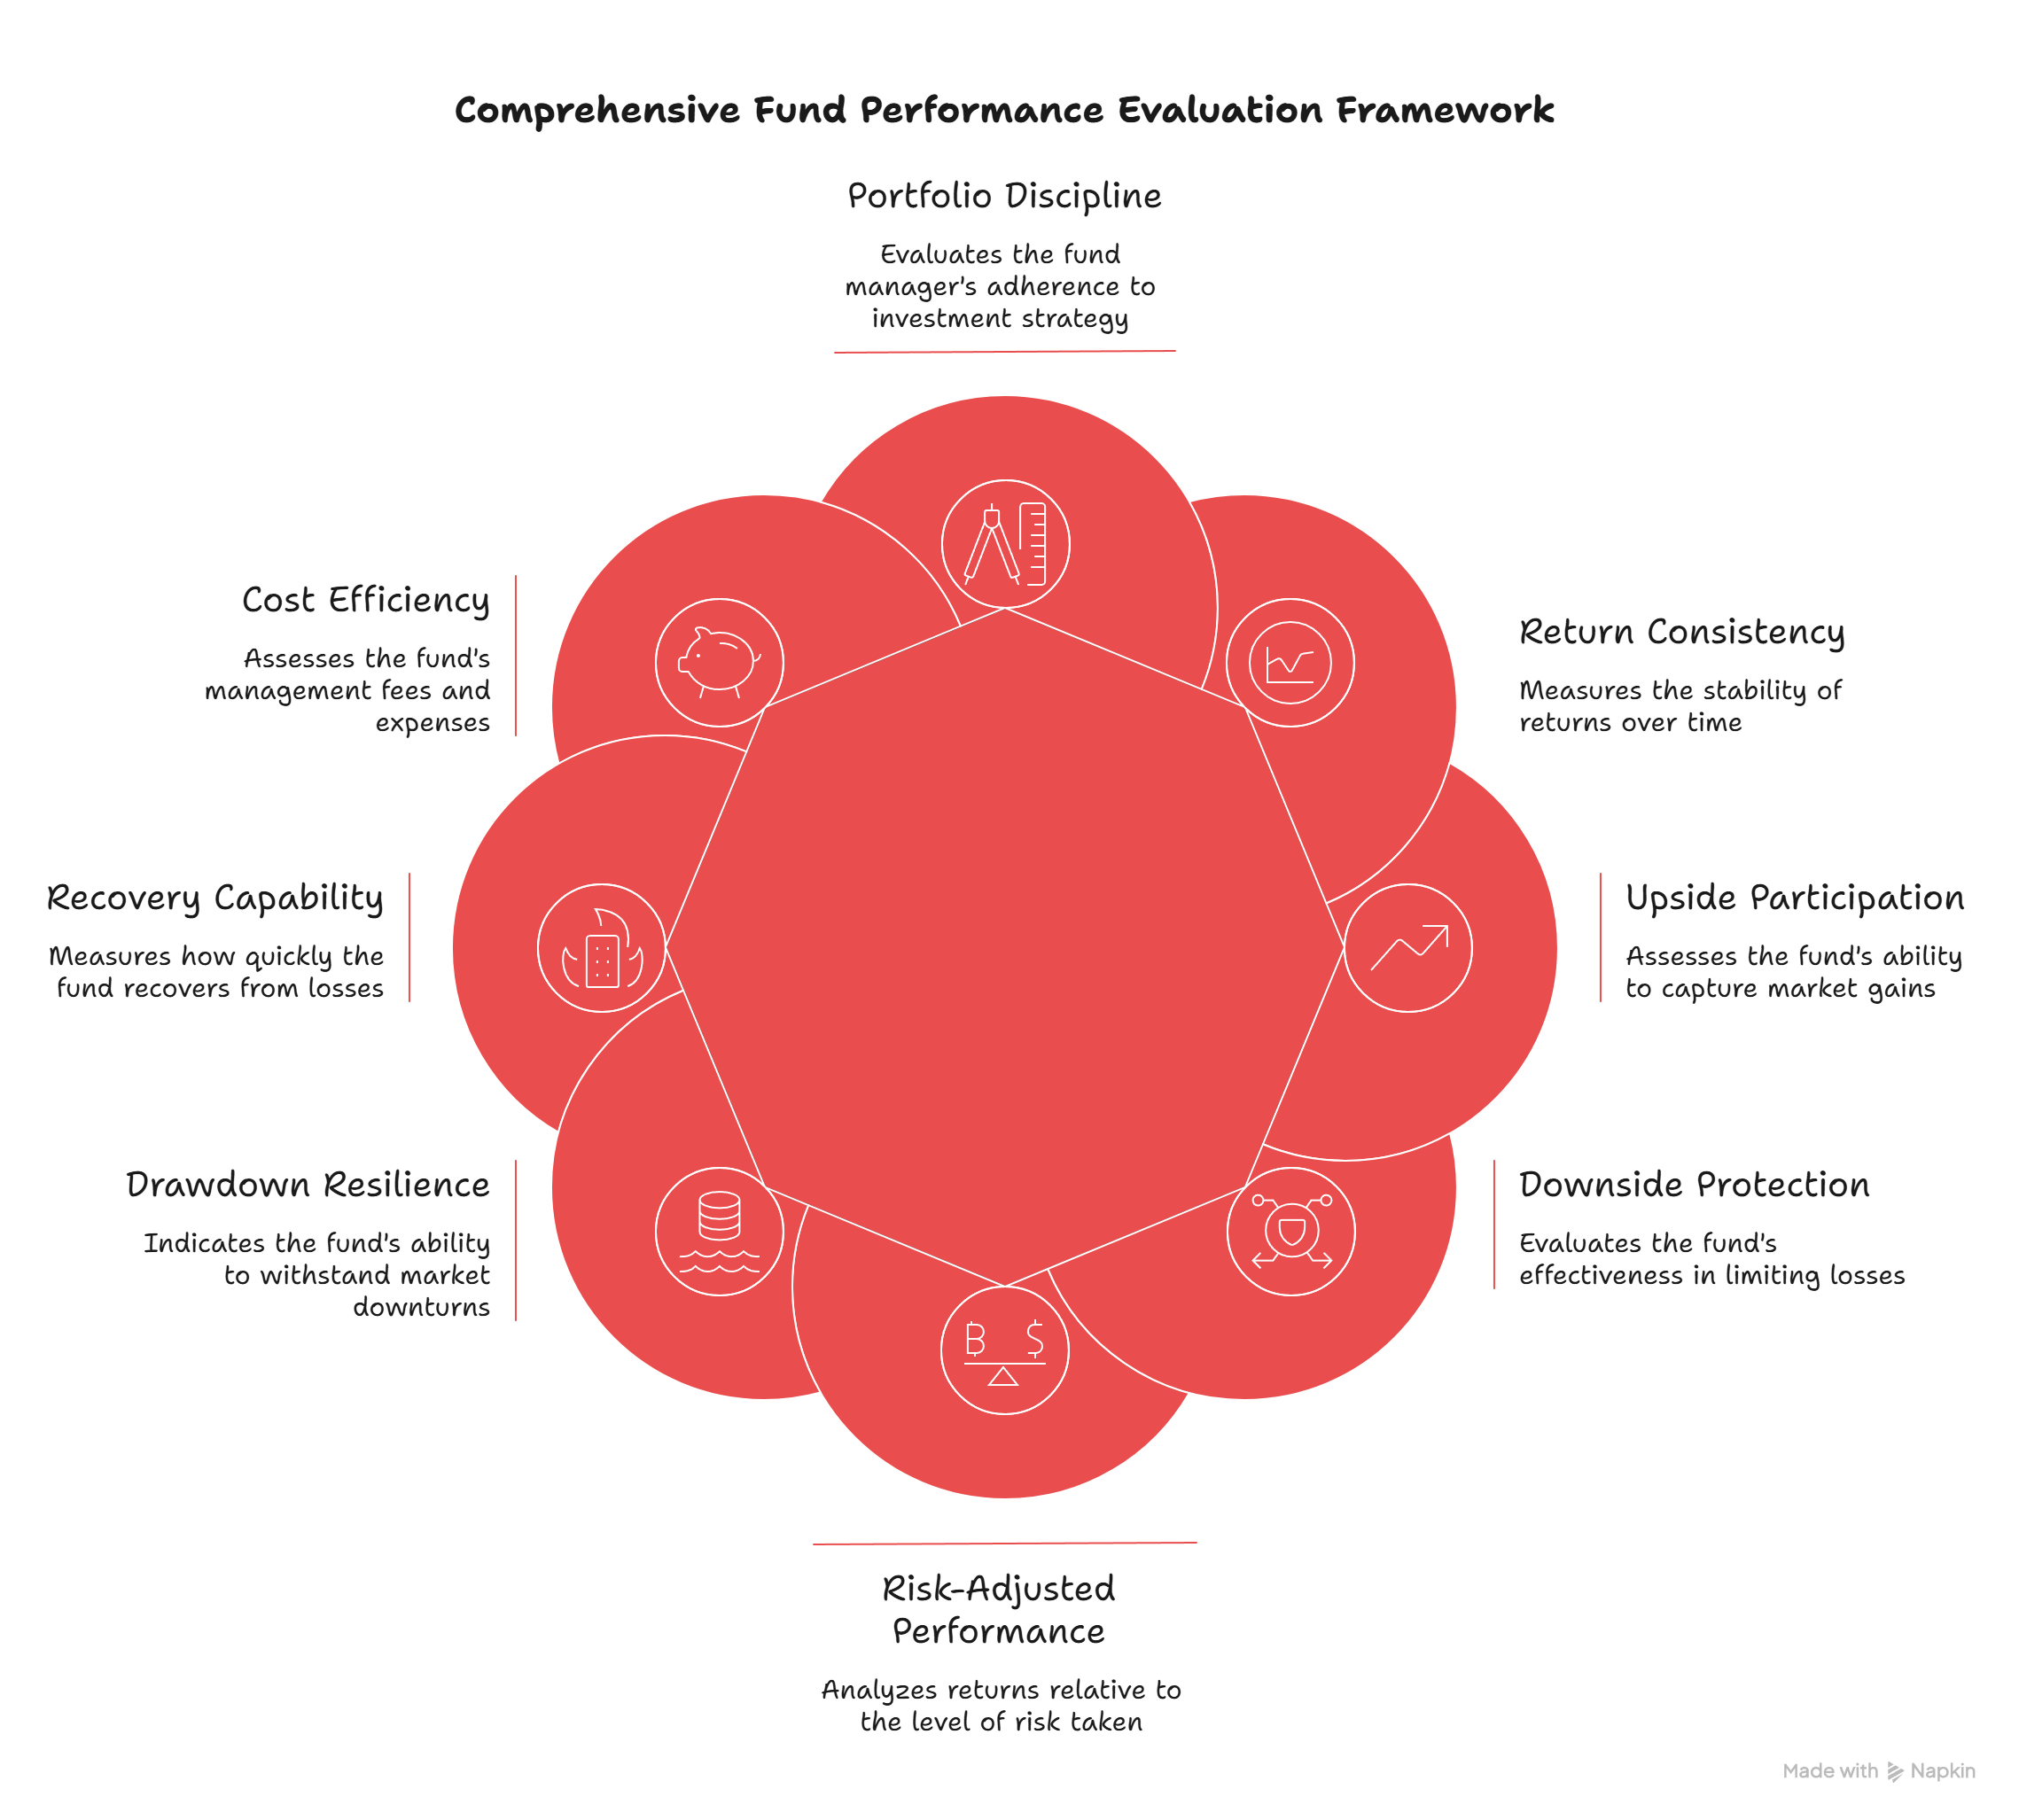
A good midcap fund should not be judged only by returns. It should also be judged by how those returns were achieved. The model therefore looks at multiple dimensions of fund quality, including:
- Return consistency
- Upside participation
- Downside protection
- Risk-adjusted performance
- Drawdown resilience
- Recovery speed
- Cost efficiency
- Portfolio discipline
Rather than rewarding a single strong performance period, the screener aims to identify funds that have demonstrated stronger behavior across market cycles.
Why Traditional Fund Rankings Can Be Misleading
Most fund comparison websites rank funds using trailing returns. The problem is that returns can be heavily influenced by the specific start and end dates selected. A fund that ranks near the top over one period may rank much lower over another equally valid period.
This is particularly true in the midcap category, where market cycles can be powerful and volatile. That is why the screener places greater emphasis on consistency and repeatability rather than relying solely on point-to-point returns.
Understanding The Metrics
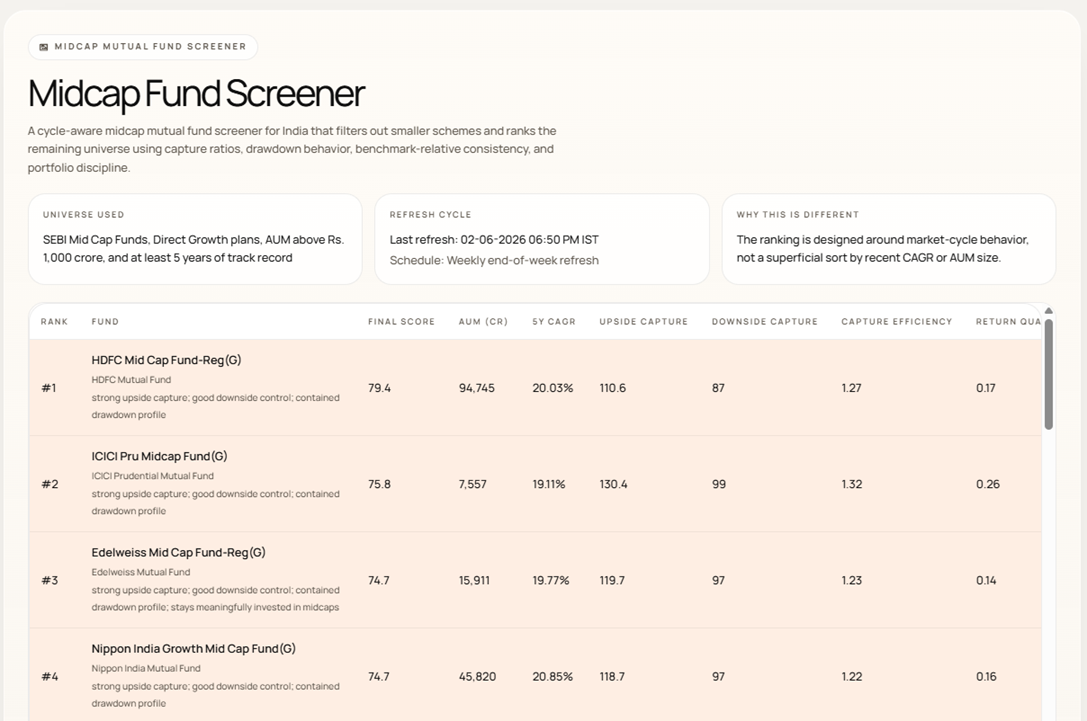
Each column in the screener represents a different aspect of fund quality.
Rank & Final Score
The Rank represents the fund's overall position in the screener. This ranking is based on the Final Score, which combines all factors used in the model. It is not simply a return ranking but a broader assessment of performance quality, risk management, consistency, and portfolio characteristics.
5Y CAGR / 3Y Rolling Return
Returns still matter and therefore remain an important part of the model. The screener uses return-based metrics as a performance validation layer, but they do not dominate the rankings. Consistency across multiple market phases is given greater importance than one strong historical return number.
Upside Capture
Upside Capture measures how effectively a fund participates when markets are rising. A higher value generally indicates that the fund has historically captured a larger share of market gains during favorable periods. Since investors choose midcap funds for growth potential, upside participation remains an important consideration.
Downside Capture
Downside Capture measures how much of the market's decline the fund participates in during difficult periods. Lower values are generally preferable because they indicate better downside control and lower investor pain during market corrections.
Capture Efficiency
One of the most useful metrics in the screener is Capture Efficiency. It combines upside and downside behavior into a single measure, helping identify funds that have participated well during rallies while controlling losses during market declines. This balance is often a sign of a stronger investment process.
Return Quality
Return Quality is based on an Information Ratio-style concept. Rather than simply asking whether a fund beat its benchmark, it evaluates how consistently and efficiently the fund generated benchmark-relative excess returns. The emphasis is on repeatability rather than occasional outperformance.
Sortino Ratio
The Sortino Ratio is a downside-focused risk-adjusted performance metric. Unlike measures that penalize all volatility equally, Sortino focuses specifically on harmful downside volatility. Funds with higher Sortino ratios have historically delivered returns more efficiently relative to downside risk.
Maximum Drawdown
Maximum Drawdown measures the largest peak-to-trough decline experienced by the fund. This is one of the most practical risk metrics because it reflects the worst historical decline an investor would have experienced. Lower drawdowns generally indicate a smoother investment journey.
Recovery (Months)
Recovery measures how long the fund took to recover after a significant drawdown. Two funds may experience similar declines, but the one that recovers faster often provides a better investor experience and demonstrates greater resilience.
Expense Ratio
Costs matter because they directly impact investor returns. However, expense ratio is only one component of the model. A slightly more expensive fund can still be a superior choice if it demonstrates stronger consistency, downside control, and overall execution.
3Y Alpha Hit Rate
This is one of the consistency-focused measures in the screener. It reflects how frequently the fund has delivered stronger benchmark-relative performance across multiple rolling periods. The objective is to identify repeatable performers rather than funds that happened to shine during one favorable window.
What Makes This Screener Different?
This screener takes a more holistic approach by evaluating both outcomes and behavior. It attempts to answer questions such as:
- Has the fund been consistent?
- Does it participate effectively during strong markets?
- Does it protect capital during weak markets?
- Has it generated returns efficiently?
- How severe have its drawdowns been?
- How quickly does it recover?
- Does the portfolio remain disciplined?
By combining these factors, the screener aims to create a higher-quality shortlist for investors.
How To Access this Screener
The screener can be found on our community tools page below:
Final Thoughts
The purpose of this Midcap Mutual Fund Screener is simple: To evaluate midcap funds in a more thoughtful way than simply sorting by recent returns.
By incorporating consistency, upside participation, downside protection, risk-adjusted performance, drawdown resilience, recovery behavior, costs, and portfolio discipline, the screener attempts to provide a more complete view of fund quality. No screener can predict future performance.
What it can do is improve the quality of the shortlist and help investors make more informed decisions. That is the philosophy behind this model. And that is exactly what this screener was built to do.
Hope you find this tool useful. As always, your feedback and suggestions are most welcome. Happy investing!
More from Investing
Is the Stock Market Quietly Killing Human Creativity and productivity?
For centuries, human progress has been driven by people who built things—engineers, scientists, entrepreneurs, artists and inventors. But as financial markets become...
How to Build a robust Passive Index Investing System that works
Passive investing has transformed the way investors build wealth. But with so many choices—from Nifty 50 Index Funds and Nifty Next 50...
A Simple, Peaceful ETF Rotation Strategy That Delivered 32% CAGR
Markets are constantly shifting leadership between sectors, asset classes, and global markets. Instead of trying to predict where the next opportunity might...