
Algo Trading
Mahesh Kaushik's Hommagenius ETF Strategy backtested

FabTrader
Article overview
Every now and then, you come across a trading strategy that looks deceptively simple, but behind it lies a solid logic. The Hommagenius Strategy is one such example.
Every now and then, you come across a trading strategy that looks deceptively simple, but behind it lies a solid logic. The Hommagenius Strategy is one such example.
This strategy was introduced to me through Mahesh Chander Kaushik, a well-known YouTuber who shares practical trading strategies. Interestingly, the roots of this approach go all the way back to Homma Munehisa, the legendary Japanese rice trader often credited with inventing candlestick charting.
I’ve been curious about this strategy for a while and finally got the chance to backtest it recently using my own Python backtesting framework. (In fact, this is the same framework I teach in my course on Backtesting Trading Strategies using AI and Python – if you’re interested, I’ll share the link at the end of this post).
Let me walk you through the rules, the logic behind them, and what my test results revealed.
Why the Strategy Makes Sense
At its heart, this strategy banks on one simple assumption:
ETFs (Exchange Traded Funds), since they represent a basket of stocks, tend to rise over the long run.
Think about it: ETFs track indices or themes, and indices themselves are designed to keep moving upwards over time. Underperforming stocks get replaced, businesses grow, and inflation pushes nominal values higher.
So if ETFs naturally drift upwards in the long run, the opportunity lies in buying during short-term weakness and then selling during recoveries. That’s exactly what the Homna Strategy does.
The Rules
I tested this strategy on weekly candlestick data of some of the most liquid ETFs on the NSE.
Entry Rules
- At the end of the week, if the weekly candle is red (Close < Open) and the ETF is not already in holding, buy one lot at the Close price.
- If the ETF is already in holding, and the price has fallen 3.14% from the last buy price, buy another lot (averaging down).
Exit Rules
- Exit when the ETF has risen 3.14% from its buy price. I increased this limit and found to produce better returns (best settings included within the backtest code)
- On each weekly cycle, perform exits before entries so that released capital can be reused.
Position Sizing
I tested two position sizing methods:
- Static Allocation – A flat ₹20,000 per trade, with another ₹20,000 added for averaging.
- Dynamic Allocation – Portfolio value divided by a fixed number (say 40) to determine position size.
For costs, I included a ₹40 flat brokerage per round trade, and ignored slippage (since ETFs are liquid).
Bearish vs Bullish Versions
Test period was from 1-Jan-2020 to end of Aug-2025. I actually tested two variations
- Bearish Version – Buy on red candles (weakness).
- Bullish Version – Buy on green candles (strength).
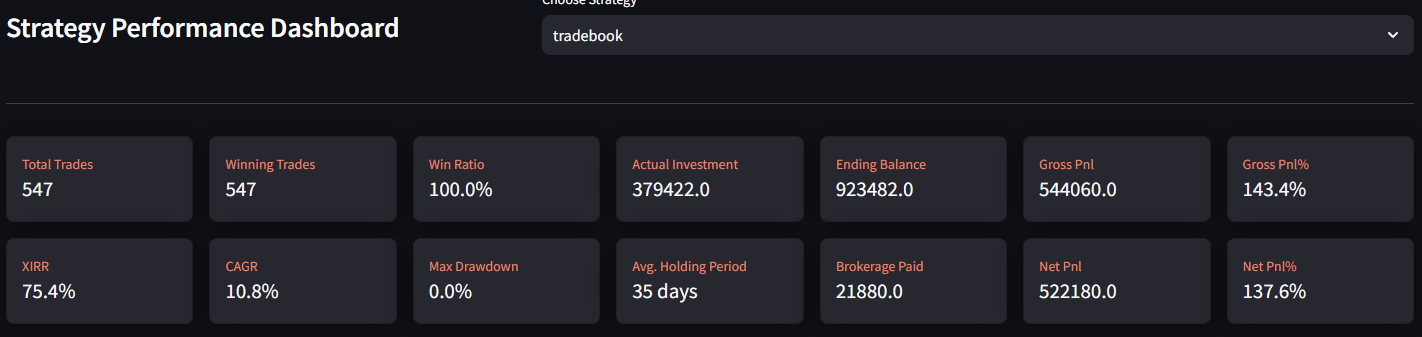
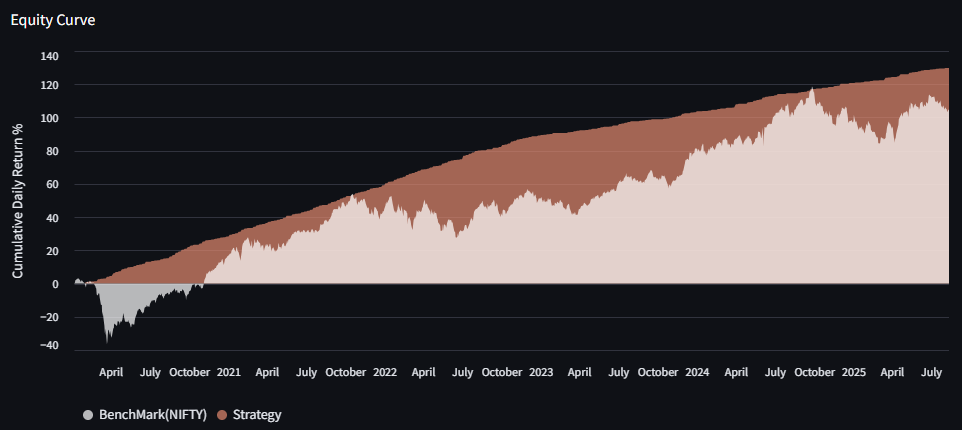
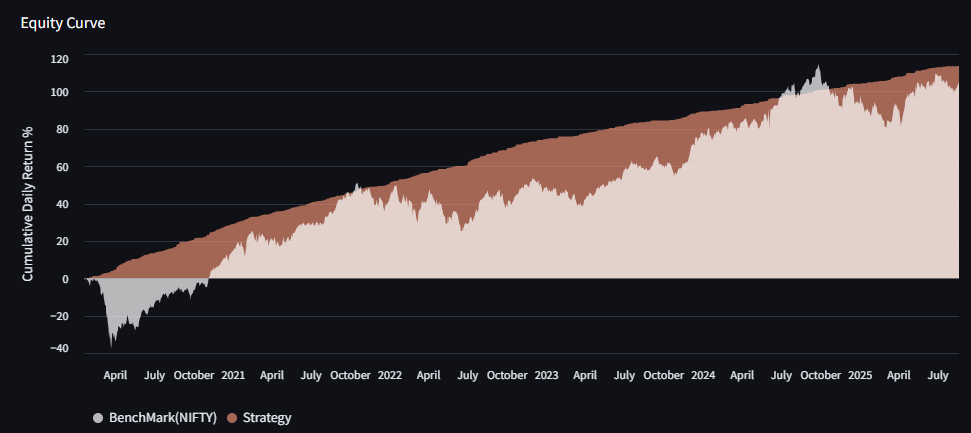
The results were interesting: the Bearish Version did better in terms of returns.
And it makes sense. By buying on weakness, you essentially get ETFs at a discount and then exit on recovery. The Bullish Version, on the other hand, often ends up buying after strength has already shown up, which reduces the edge.
Bearish Version Test Results
Bullish Version Test Results

My Observations
A few things really stood out for me in this backtest:
- The strategy is remarkably simple to follow, no indicators, no heavy computation.
- The 3.14% rule is smart — wide enough to avoid noise, but tight enough to trigger frequent trades.
- The edge lies in the fact that ETFs don’t go to zero (unlike individual stocks). They are baskets, and in the long run, they recover.
Of course, the strategy isn’t bulletproof. In long bear markets, ETFs may take longer to recover. But for swing trading, especially in markets like India where ETFs are gaining traction, this framework has a lot of potential.
For the Community
To help others explore this further, I’ve packaged everything into a Community Shop resource. You can find mroe details on the backtest results as part of this resource:
- ✅ Full Python backtest code
- ✅ Trade logs (CSV) - Bullish and Bearish Variations
- ✅ A full Strategy Performance Metric Report with Equity Curve, drawdown, XIRR, CAGR, Fund Utilisation, Monthly returns heatmap and a year-on-year report on whether the strategy exceed benchmark returns
You can grab it here → [Community Shop Link]
How I Backtested This
I have a full-fledged backtesting framework in Python, built to test trading strategies with precision.
More from Algo Trading
Algo Trading Cost in India: How I Built a Reliable Setup for ₹150/Month
Wondering how much algo trading costs in India? In this article, I break down the real expenses involved in running an algorithmic...
When Your Job Feels Shaky: Can Trading Become an Alternate Income Stream?
Can trading become a stable source of income in India? While many consider it during times of job uncertainty, the reality is...
How Much Capital Do You Really Need for Sustainable Trading Income in India?
How much capital is needed for sustainable trading income in India? This in-depth guide explores the realistic returns traders can expect, the...