
Investing
Intraday vs Overnight: The Hidden Truth About Market Returns

FabTrader
Article overview
What if I told you that most of the market’s gains don’t happen when the markets are open — but when you’re asleep?
What if I told you that most of the market’s gains don’t happen when the markets are open — but when you’re asleep?
Sounds unbelievable, right? Yet, several decades of data — from Wall Street to Dalal Street — seem to confirm it. The markets, it turns out, often make more money overnight than during intraday hours.
This article explores that fascinating anomaly — popularly known as the “Overnight Effect” — and lets you test it yourself with a simple Python script.
The Backstory — The Birth of a Market Anomaly
The roots of this idea go back to the 1970s and 80s, when researchers like Ken French and Eugene Fama were studying the Efficient Market Hypothesis (EMH).
EMH suggested that prices instantly reflect all available information — meaning there shouldn’t be any consistent patterns to exploit.
But when Ken French analyzed returns across days of the week, he found something strange — a recurring pattern where markets lost money over weekends (Friday close to Monday open) but gained during weekdays. This came to be known as the “Weekend Effect.”
Later, French and other researchers noticed an even deeper pattern — that returns during non-trading hours (overnight) behaved very differently from returns during trading hours (intraday).
That became the foundation for what we now call the Overnight Effect — sometimes referred to as the “grandmother of all market anomalies.”
The Hypothesis — Intraday vs Overnight Returns
Let’s formally define what we’re testing:
(Close - Open) / OpenReturn during market hoursOvernight Return(Open - Previous Close) / Previous CloseReturn when the market is closedWe’ll analyze which contributes more to cumulative returns — the intraday move or the overnight gap.
Test It Yourself — The Python Code
Here’s a complete, ready-to-run Python script that lets you fetch data for any stock or index and visualize how intraday and overnight returns compare.
import yfinance as yf
import pandas as pd
import matplotlib.pyplot as plt

pd.set_option("display.max_rows", None, "display.max_columns", None)

ticker = "INFY.NS"     # You can change this to any stock, e.g. "RELIANCE.NS"
start_date = "2010-01-01"
end_date = "2024-12-31"

# -------------------------------
# Fetch Data
# -------------------------------
df = yf.download(ticker, start=start_date, end=end_date, progress=False,
                 multi_level_index=False, auto_adjust=True)
df = df[['Open', 'Close']].dropna()

# -------------------------------
# Compute Returns
# -------------------------------
# Intraday return = (Close - Open) / Open
df['Intraday_Return'] = (df['Close'] - df['Open']) / df['Open']

# Overnight return = (Next Day Open - Previous Day Close) / Previous Day Close
df['Overnight_Return'] = (df['Open'] - df['Close'].shift(1)) / df['Close'].shift(1)
df = df.dropna()

# -------------------------------
# Compute Cumulative Returns
# -------------------------------
df['Intraday_Equity'] = (1 + df['Intraday_Return']).cumprod()
df['Overnight_Equity'] = (1 + df['Overnight_Return']).cumprod()
print("*********************************************************")
print("              Overnight Vs Intraday Strategy             ")
print("*********************************************************")
print("Ticker : ", ticker )
print("Intraday Strategy Equity Returns : ", round (df['Intraday_Equity'].iloc[-1] * 100, 1),"%")
print("Overnight Strategy Equity Returns : ", round(df['Overnight_Equity'].iloc[-1] * 100, 1),"%")

# -------------------------------
# Compute Yearly Returns
# -------------------------------
df['Year'] = df.index.year
annual = df.groupby('Year')[['Intraday_Return', 'Overnight_Return']].apply(
    lambda x: ((1 + x).prod() - 1) * 100
)
annual.columns = ['Intraday_Annual', 'Overnight_Annual']

# -------------------------------
# Summary Statistics
# -------------------------------
# 1️⃣ Count how many times each strategy gave negative returns
negative_intraday = (annual['Intraday_Annual'] < 0).sum()
negative_overnight = (annual['Overnight_Annual'] < 0).sum()

# 2️⃣ Compare which strategy outperformed in each year
overnight_better = (annual['Overnight_Annual'] > annual['Intraday_Annual']).sum()
intraday_better = (annual['Intraday_Annual'] > annual['Overnight_Annual']).sum()
equal_years = len(annual) - overnight_better - intraday_better

# 3️⃣ Additional insights
avg_intraday = annual['Intraday_Annual'].mean()
avg_overnight = annual['Overnight_Annual'].mean()

best_intraday_year = annual['Intraday_Annual'].idxmax()
best_overnight_year = annual['Overnight_Annual'].idxmax()

worst_intraday_year = annual['Intraday_Annual'].idxmin()
worst_overnight_year = annual['Overnight_Annual'].idxmin()

# 4️⃣ Print summary
print("*********************************************************")
print("              Overnight Vs Intraday Strategy             ")
print("*********************************************************")
print("Ticker : ", ticker )
print(f"Period Analyzed: {annual.index.min()}–{annual.index.max()}")
print(f"Number of Years: {len(annual)}")
print("------------Returns Summary -------------")
print("Intraday Strategy Equity Returns : ", round (df['Intraday_Equity'].iloc[-1] * 100, 1),"%")
print("Overnight Strategy Equity Returns : ", round(df['Overnight_Equity'].iloc[-1] * 100, 1),"%")
print("----------------------------------------")
print(f"Intraday Strategy:")
print(f"  • Negative years : {negative_intraday}")
print(f"  • Average annual return : {avg_intraday:.1f}%")
print(f"  • Best year  : {best_intraday_year} ({annual.loc[best_intraday_year, 'Intraday_Annual']:.1f}%)")
print(f"  • Worst year : {worst_intraday_year} ({annual.loc[worst_intraday_year, 'Intraday_Annual']:.1f}%)")
print("----------------------------------------")
print(f"Overnight Strategy:")
print(f"  • Negative years : {negative_overnight}")
print(f"  • Average annual return : {avg_overnight:.1f}%")
print(f"  • Best year  : {best_overnight_year} ({annual.loc[best_overnight_year, 'Overnight_Annual']:.1f}%)")
print(f"  • Worst year : {worst_overnight_year} ({annual.loc[worst_overnight_year, 'Overnight_Annual']:.1f}%)")
print("----------------------------------------")
print(f"Comparison:")
print(f"  • Overnight outperformed Intraday in {overnight_better} years")
print(f"  • Intraday outperformed Overnight in {intraday_better} years")
print("========================================")

# -------------------------------
# Plot 1: Equity Curves
# -------------------------------
plt.figure(figsize=(12, 6))
plt.plot(df.index, df['Intraday_Equity'] * 100, label='Intraday Strategy', color='tab:blue')
plt.plot(df.index, df['Overnight_Equity'] * 100, label='Overnight Strategy', color='tab:orange')
plt.title(f"{ticker} — Intraday vs Overnight Equity Curve")
plt.xlabel("Date")
plt.ylabel("Cumulative Growth (Starting from 1)")
plt.legend()
plt.grid(True)
plt.show()

# -------------------------------
# Plot 2: Yearly Returns Comparison
# -------------------------------
annual.plot(kind='bar', figsize=(12, 6))
plt.title(f"{ticker} — Yearly Returns Comparison: Intraday vs Overnight")
plt.xlabel("Year")
plt.ylabel("Annual Return")
plt.grid(True, axis='y')
plt.legend(["Intraday Returns", "Overnight Returns"])
plt.tight_layout()
plt.show()
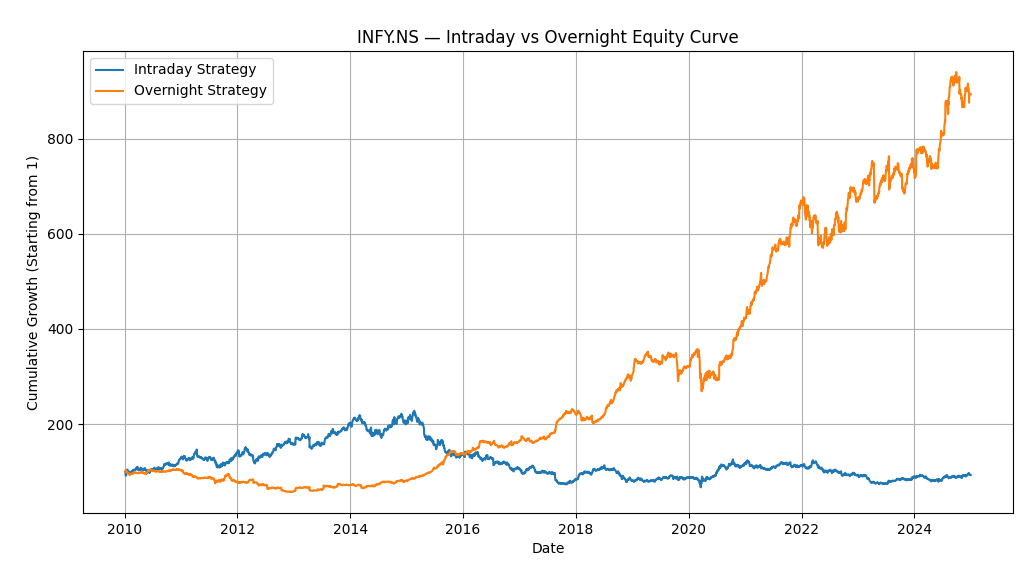
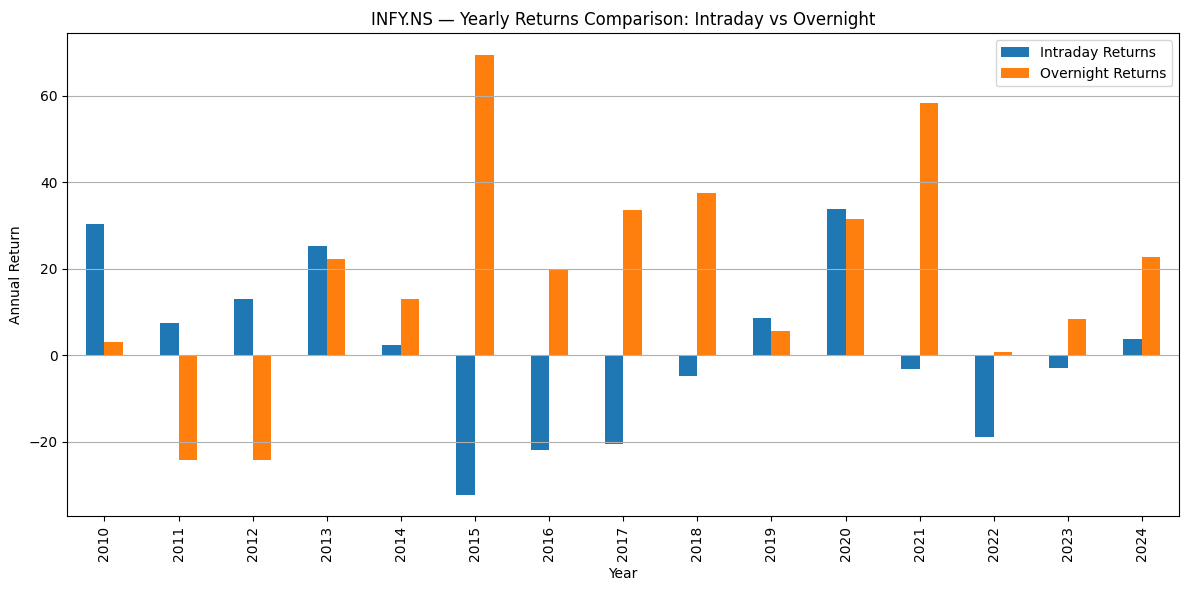
*********************************************************
              Overnight Vs Intraday Strategy
*********************************************************
Ticker :  INFY.NS
Intraday Strategy Equity Returns :  93.2 %
Overnight Strategy Equity Returns :  893.6 %
*********************************************************
              Overnight Vs Intraday Strategy
*********************************************************
Ticker :  INFY.NS
Period Analyzed: 2010–2024
Number of Years: 15
------------Returns Summary -------------
Intraday Strategy Equity Returns :  93.2 %
Overnight Strategy Equity Returns :  893.6 %
----------------------------------------
Intraday Strategy:
  • Negative years : 7
  • Average annual return : 1.3%
  • Best year  : 2020 (33.7%)
  • Worst year : 2015 (-32.2%)
----------------------------------------
Overnight Strategy:
  • Negative years : 2
  • Average annual return : 18.5%
  • Best year  : 2015 (69.3%)
  • Worst year : 2012 (-24.3%)
----------------------------------------
Comparison:
  • Overnight outperformed Intraday in 9 years
  • Intraday outperformed Overnight in 6 years
========================================
Run this for any instrument — NIFTY, INFY.NS, HDFCBANK.NS, SPY, or TSLA — and see what story the data tells you.
What the Data Typically Shows
When you run this test, you’ll likely see what decades of research have shown:
- Overnight returns compound steadily over time.
- Intraday returns often oscillate or even trend downward.
- The gap between the two widens over years — visually striking on the equity curve.
Why does this happen?
A few possible reasons:
- Information flows when markets are closed — earnings, policy changes, macro news.
- Global market linkages — U.S. or Asian markets influence the next day’s open in India.
- Risk premium for holding overnight — investors expect compensation for uncertainty.
- Structural market changes — pre-open sessions, algorithmic price discovery.
So, Should We All Just Do BTST (Buy Today, Sell Tomorrow)?
At this point, a natural question comes to mind:
“If overnight returns have historically outperformed intraday returns, should I simply buy before the market closes and sell the next morning?”
It’s a fair question — and one that every trader who sees this data eventually asks.
On paper, the logic sounds almost irresistible. If most of the gains happen between Close → Open, why bother with the stress, volatility, and noise of the intraday session at all? Why not just trade the night shift of the market?
But here’s where it gets interesting.
The Buy Today, Sell Tomorrow (BTST) idea looks beautifully simple when viewed in spreadsheets and charts — yet its real-world behavior is far more complex. There are important factors that determine whether this overnight edge is actually tradable or just a statistical illusion.
Rather than rushing to conclusions, it’s worth taking a step back and exploring why this strategy often diverges from expectation when applied live — and what traders need to be mindful of before attempting to capture this effect.
That’s exactly what we’ll uncover in the next FabTrader article —
“BTST: Why It Looks Great on Paper, But Rarely Works in Practice.”
We’ll explore what happens beneath the surface — how execution, structure, and market behavior all play a role — and see whether BTST can be turned into a real edge, or if it’s best left as an academic curiosity.
Stay tuned — it’s going to be an eye-opening follow-up.
Final Thoughts
The Overnight Effect is one of those market mysteries that challenges how we think about returns.
It reminds us that markets move when humans react — and news doesn’t wait for trading hours.
With the code above, you can now:
- Test this phenomenon yourself
- Visualize how returns behave
- Dig deeper to build your own strategies
So go ahead — pick a stock, run the script, and share what you discover!
More from Investing
Is the Stock Market Quietly Killing Human Creativity and productivity?
For centuries, human progress has been driven by people who built things—engineers, scientists, entrepreneurs, artists and inventors. But as financial markets become...
Beyond Returns: Why I Built a More Intelligent Midcap Mutual Fund Screener
Looking for the best midcap mutual funds in India? This article explains how our Midcap Mutual Fund Screener goes beyond traditional return-based...
How to Build a robust Passive Index Investing System that works
Passive investing has transformed the way investors build wealth. But with so many choices—from Nifty 50 Index Funds and Nifty Next 50...