
Investing
Buffet Indicator : Indian Stock Market Over Heating?

FabTrader
Article overview
Investors often look for reliable ways to gauge the valuation of stock markets and assess whether they are reasonably priced, overvalued, or undervalued. One of the most popular tools in this space is the Buffet Indicator — famously endorsed by Warren Buffett himself. The indicator is calculated by dividing the total...
Investors often look for reliable ways to gauge the valuation of stock markets and assess whether they are reasonably priced, overvalued, or undervalued. One of the most popular tools in this space is the Buffet Indicator — famously endorsed by Warren Buffett himself. The indicator is calculated by dividing the total market capitalization by the country’s GDP
Following is my attempt to apply this indicator on Indian markets and the insights are interesting. Take a look.
What is Buffet Indicator?
The formula is simple:
Buffet Indicator (%) = (Total Market Capitalization / GDP) × 100
This ratio provides a big-picture view of the market's valuation relative to the economy's size. Here's the generally accepted valuation scale:
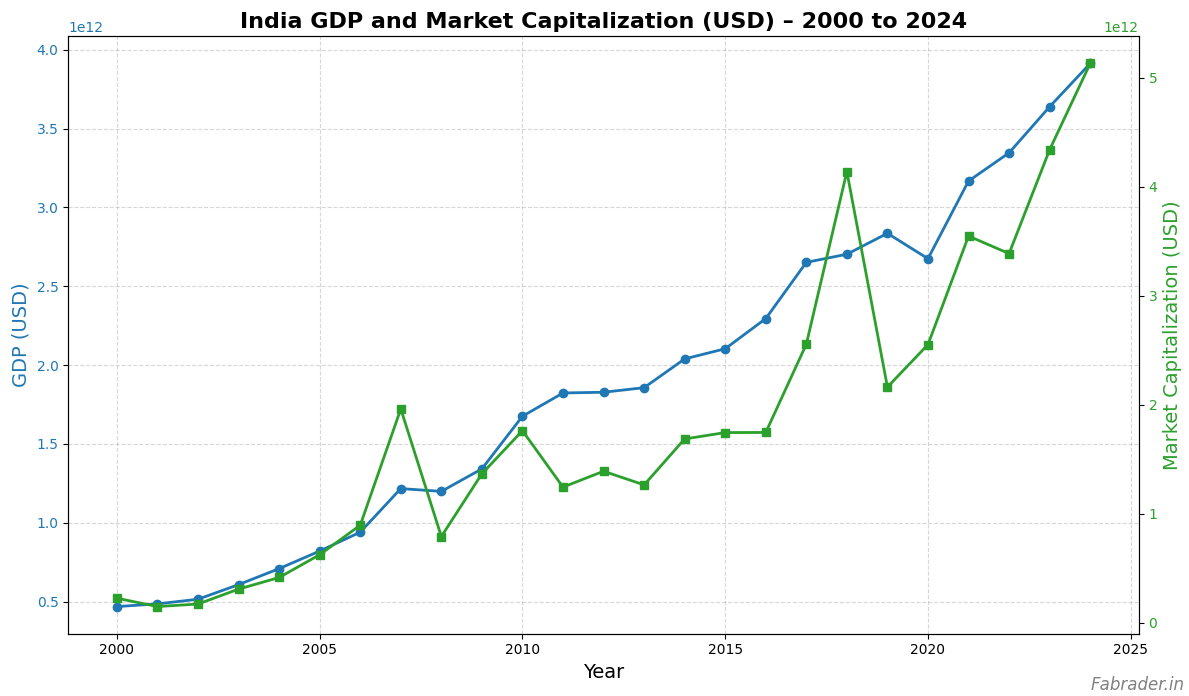
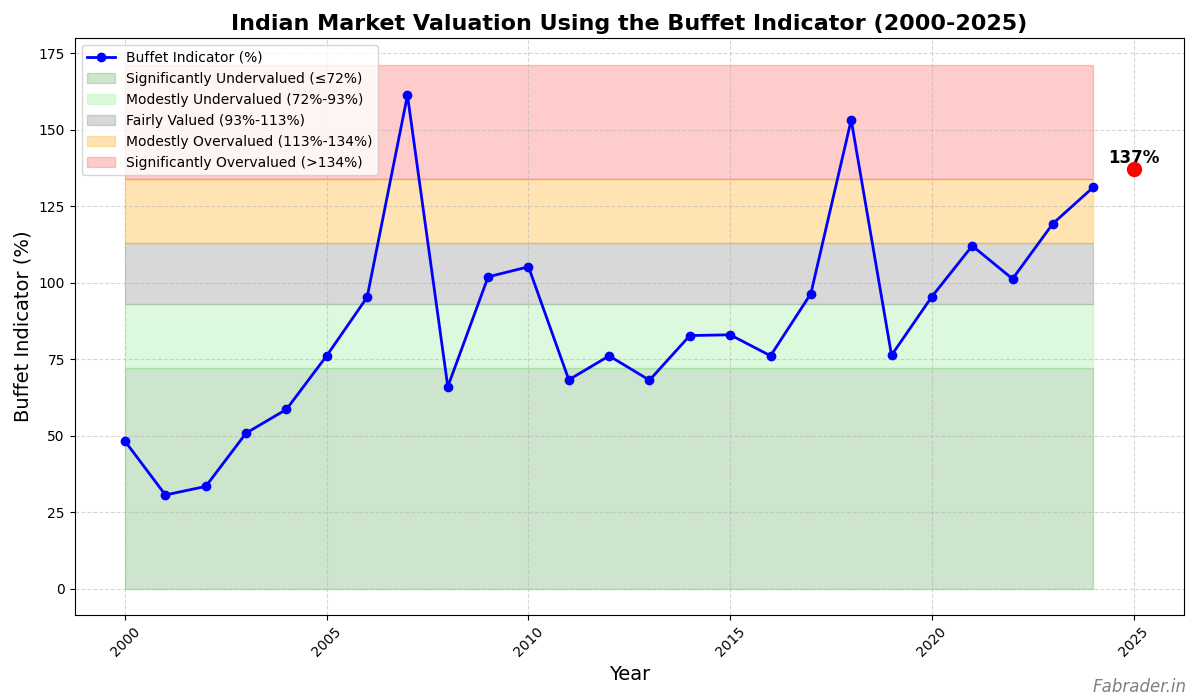
Indian Market’s Journey (2000 – 2025)
Analyzing the Indian stock market over the past 25 years reveals fascinating trends. Historically, the market moved in sync with economic growth and global events. But in 2025 (as of 5-Sep-2025), the Buffet Indicator has surged to 137%. This marks a significant overvaluation zone, signaling that the market cap of listed companies has outpaced the country's GDP growth considerably.
- GDP (INR Crores): ₹33,072,800
- Market Capitalization (INR Crores): ₹45,194,437
- Buffet Indicator: 137%
What is the Buffet Indicator telling us?
Buffet Indicator at 137%, theoretically is indicating an over-heated market, which could cause an imminent crash (at minimum, a major correction)? Should we take this seriously and Investors reassess portfolio allocations, and prepare for potential corrections?
Does the Buffet Indicator Really Apply to Emerging Markets Like India?
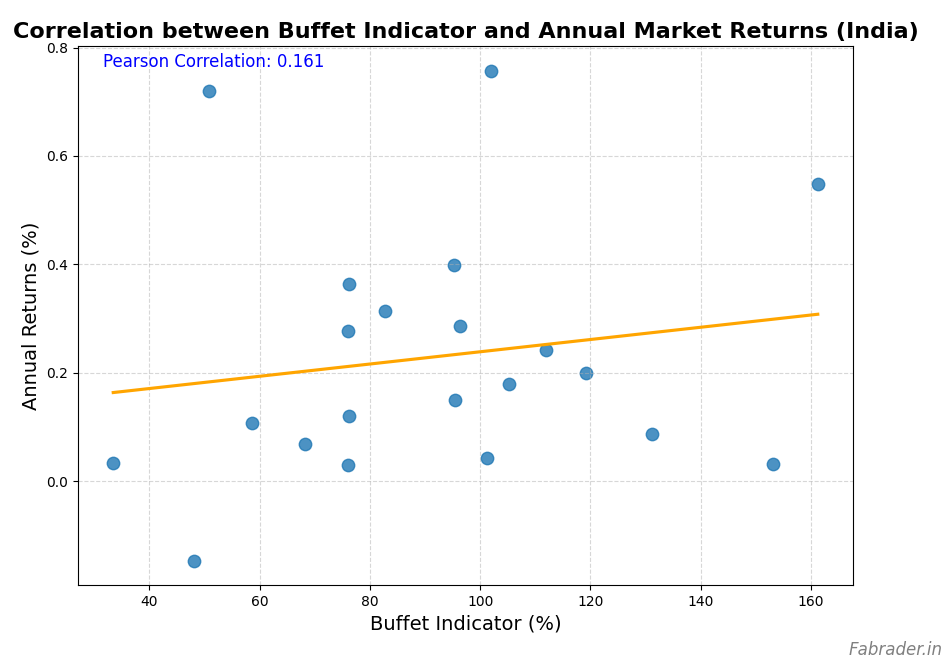
Lets dig a little deeper. To be fully certain, what if we drew a correlation between the historic buffet indicator value to the stock market annualized returns? I just did that, and following are the findings.
What I Found
- Correlation Coefficient: 0.161 (a very weak positive correlation)
- P-Value: 0.486 (statistically insignificant)
This means there is no strong evidence that higher Buffet Indicator values have historically led to lower (or higher) annual market returns in India.
Here’s a visual representation of the data:
What Does This Mean?
Unlike the US and other mature markets where the Buffet Indicator often provides useful valuation signals, our analysis shows that in India’s case, this indicator doesn’t seem to hold predictive power for future returns.
The Indian market is much more influenced by structural growth, evolving policies, foreign investment flows, and other macroeconomic factors unique to emerging economies.
👉 The current high Buffet Indicator value may reflect optimism about long-term growth rather than imminent risk of a sharp correction.
Final Thought
While the Buffet Indicator serves as a useful valuation heuristic in mature markets, it should be viewed with caution when applied to emerging markets like India. My findings suggest that the Indian stock market’s trajectory won’t necessarily follow the same rules as developed markets at this point in time. Instead of panic, investors should focus on India’s growth story, economic reforms, and corporate earnings over the coming years.
Data Sources
- GDP Data: World Bank Group (worldbank.org)
- Market Capitalization Data: BSE India (bseindia.com)
At Fabrader.in, my goal is to empower investors with clean data-driven insights. Follow our journey as we help demystify the markets and help you build long-term wealth.
More from Investing
Is the Stock Market Quietly Killing Human Creativity and productivity?
For centuries, human progress has been driven by people who built things—engineers, scientists, entrepreneurs, artists and inventors. But as financial markets become...
Beyond Returns: Why I Built a More Intelligent Midcap Mutual Fund Screener
Looking for the best midcap mutual funds in India? This article explains how our Midcap Mutual Fund Screener goes beyond traditional return-based...
How to Build a robust Passive Index Investing System that works
Passive investing has transformed the way investors build wealth. But with so many choices—from Nifty 50 Index Funds and Nifty Next 50...