
Python
Understanding Stock Correlation in Markets: Python Tool for Algo Traders

FabTrader
Article overview
Most traders focus on entries, exits, and returns, but often overlook how their stocks and strategies move together. Correlation reveals these hidden relationships and helps uncover risks that aren’t visible when looking at trades in isolation. This article explains why correlation matters, how algo traders can use it effectively, and how a simple correlation tool can add clarity to portfolio decisions.
When most traders think about risk, they think in terms of stop-losses, drawdowns, or position sizing.
But there’s another silent risk that often goes unnoticed — correlation risk.
Two strategies can look completely different on paper. Two stocks can belong to different sectors. Yet, during a market event, they can move almost identically.
That’s where correlation comes in. In this article, we’ll break down:
- What correlation really means in the markets
- Why it matters deeply for algo traders and quants
- How a simple correlation tool can significantly improve portfolio decisions
What Is Correlation in Simple Terms?
Correlation measures how two assets move relative to each other.
- +1 (or +100%) → Move perfectly together
- 0 → No relationship
- -1 (or -100%) → Move exactly opposite
In trading, we usually calculate correlation using returns, not prices. Why? Because prices drifting upward together over time doesn’t necessarily mean they react the same way day-to-day. Returns capture true co-movement.
Why Correlation Matters More Than You Think
Let’s say you’re running:
- A breakout strategy on NIFTY
- A momentum strategy on BANKNIFTY
- A trend-following system on FINNIFTY
On the surface, this looks diversified. But if these instruments show 80–90% correlation, then during a drawdown:
- All strategies lose together
- Capital erosion accelerates
- Psychological pressure increases
This is false diversification. Correlation analysis helps you answer one crucial question:
“Am I actually diversified, or just feeling diversified?”
Correlation vs Volatility (A Common Mistake)
Many traders focus heavily on volatility but ignore correlation.
- Volatility tells you how much something moves
- Correlation tells you with what it moves
A low-volatility portfolio with high correlation can still blow up during regime changes. Correlation is about behavior, not magnitude.
Why a Correlation Matrix Is the Right Visualization
Tables alone don’t scale well when you’re dealing with multiple instruments.
That’s why a correlation heatmap is ideal:
- Patterns are visible instantly
- Strong relationships stand out
- Negative correlations are easy to spot
This visual clarity is especially useful when reviewing portfolios or strategies periodically.
Inside the Tool: How This Correlation Analyzer Works
This tool:
- Fetches historical OHLC data from Yahoo Finance
- Uses adjusted closing prices
- Converts prices into daily returns
- Computes pairwise correlations
- Displays:
- A percentage-based correlation table
- A visual heatmap for quick interpretation
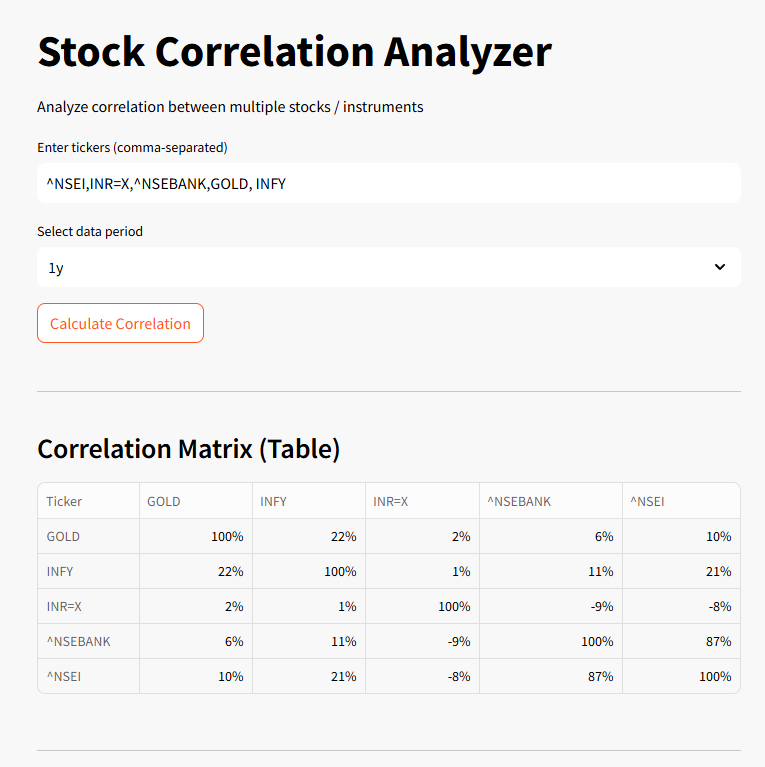
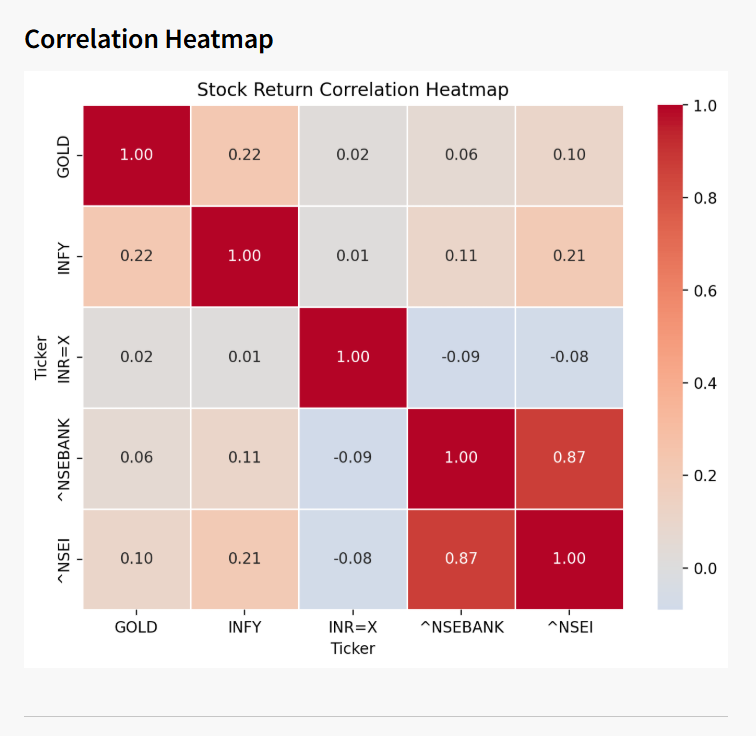
Python Code
Required Libraries (to be installed)
pip install streamlit yfinance pandas matplotlib seaborn# ---------------------------------------------------------------------
# FabTrader Algorithmic Trading Platform
# ---------------------------------------------------------------------
# Copyright (c) 2025 FabTrader (Unit of Rough Sketch Company)
#
# Stock Correlation Analyzer
#
# CONTACT:
# - Website: https://fabtrader.in
# - Email: [email protected]
# ---------------------------------------------------------------------
import streamlit as st
import yfinance as yf
import seaborn as sns
import matplotlib.pyplot as plt
st.set_page_config(page_title="Stock Correlation Analyzer", layout="centered")
st.title("Stock Correlation Analyzer")
st.write("Analyze correlation between multiple stocks / instruments")
# -------------------------------
# User Inputs
# -------------------------------
tickers_input = st.text_input(
"Enter tickers (comma-separated)",
value="^NSEI,INR=X,^NSEBANK,GOLD, INFY"
)
period = st.selectbox(
"Select data period",
["6mo", "1y", "2y", "5y"],
index=1
)
calculate = st.button("Calculate Correlation")
if calculate:
tickers = [t.strip().upper() for t in tickers_input.split(",")]
if len(tickers) < 2:
st.warning("Please enter at least two tickers.")
else:
with st.spinner("Downloading data..."):
data = yf.download(
tickers,
period=period,
auto_adjust=True,
progress=False
)
if data.empty:
st.error("No data found. Please check ticker symbols.")
else:
# Extract Adjusted Close prices
prices = data["Close"]
# Calculate daily returns
returns = prices.pct_change().dropna()
# Correlation matrix
corr_matrix = returns.corr()
# -------------------------------
# Display Table
# -------------------------------
st.divider()
st.subheader("Correlation Matrix (Table)")
st.dataframe(
corr_matrix.style
.format("{:.0%}"),
use_container_width=True
)
# -------------------------------
# Heatmap Visualization
# -------------------------------
st.divider()
st.subheader("Correlation Heatmap")
fig, ax = plt.subplots(figsize=(8, 6))
sns.heatmap(
corr_matrix,
annot=True,
fmt=".2f",
cmap="coolwarm",
center=0,
linewidths=0.5,
ax=ax
)
ax.set_title("Stock Return Correlation Heatmap")
st.pyplot(fig)
st.divider()
st.write('Made with :heart: by FabTrader. Copyright 2025 fabtrader.in - All rights reserved')A Nifty Tool, But a Serious Edge
Correlation analysis isn’t fancy. It won’t give you entry signals. It won’t predict the next big move.
But it quietly improves everything else you do. For algo traders and quant analysts, it helps:
- Build robust systems
- Avoid hidden risk
- Think in terms of portfolios, not trades
Over the long run, these small structural advantages matter more than most indicators.
Final Thoughts
If you are serious about:
- Running multiple strategies
- Managing capital professionally
- Or building toward financial independence with systems, not guesses
Then correlation analysis isn’t optional — it’s foundational. This tool is a small step in that direction, and I hope it helps you see your portfolio more clearly, not just trade it harder.
More from Python
Finding the Most Liquid Equity ETFs in each Category using Python
Not all ETFs are created equal — especially when it comes to liquidity. While NSE provides a full ETF list, identifying the...
The Market’s Coiled Spring — Building the Momentum Squeeze Indicator in Python
Volatility doesn’t expand randomly — it contracts first. The Momentum Squeeze Indicator, popularized by LazyBear, is built on this simple but powerful...
Price Consolidation Boxes: Ranges, Breakouts, and Retests Using Python
Markets don’t trend most of the time — they pause, compress, and consolidate. Before every meaningful move up or down, price typically...