
Python
The Market’s Coiled Spring — Building the Momentum Squeeze Indicator in Python

FabTrader
Article overview
Volatility doesn’t expand randomly — it contracts first. The Momentum Squeeze Indicator, popularized by LazyBear, is built on this simple but powerful market behavior. By detecting when Bollinger Bands compress inside Keltner Channels, the indicator highlights phases where price is quietly storing energy before a potential breakout. In this first part of the series, we move beyond chart overlays and build the indicator from scratch in Python using Yahoo Finance data — decoding its math, momentum engine, and squeeze logic along the way. If you’ve ever wanted to turn this TradingView favorite into a programmable, backtest-ready tool, this is where the journey begins.
If you’ve spent any meaningful time around charts, you’ve probably heard traders say:
“Volatility contracts before it expands.”
It’s one of those market truths that shows up everywhere — from quiet consolidations before breakouts to explosive intraday moves after dull opening ranges. The Momentum Squeeze Indicator, popularized by one of my favorites, LazyBear on TradingView, is built entirely around this idea. It attempts to answer a deceptively simple question:
When is the market storing energy… and when is it releasing it?
In this first part of the series, we’ll go deep into:
- What the Momentum Squeeze actually measures
- Why traders love it for intraday and swing setups
- How the math works under the hood
- And most importantly — how to build it from scratch in Python using Yahoo Finance data
In Part 2, we’ll take it further by designing and backtesting a complete trading strategy around it.
The Intuition: Markets Breathe
Think of price like a coiled spring.
There are phases where:
- Price moves in tight ranges
- Volatility dries up
- Breakouts keep failing
- Traders get bored
And then suddenly:
- Expansion begins
- Momentum builds
- Trends emerge
- Volatility spikes
The squeeze indicator is designed to detect the transition between these two states. Not lagging trend detection — but pre-breakout pressure build-up.
The Core Idea: Bollinger Bands Inside Keltner Channels
At the heart of the indicator lies a clever volatility comparison. It combines two well-known tools:
1️⃣ Bollinger Bands (BB)
Measure volatility using standard deviation.
- Expand when price is volatile
- Contract when price is quiet
2️⃣ Keltner Channels (KC)
Measure volatility using ATR / True Range.
- More stable than Bollinger Bands
- React differently to price compression
The “Squeeze” Condition
A squeeze occurs when:
Bollinger Bands move inside Keltner Channels
Mathematically:
Lower BB > Lower KC
Upper BB < Upper KC
This means:
- Standard deviation volatility < ATR volatility
- Price is unusually compressed
- Energy is building
When BB moves back outside KC → squeeze releases.
Visual Interpretation
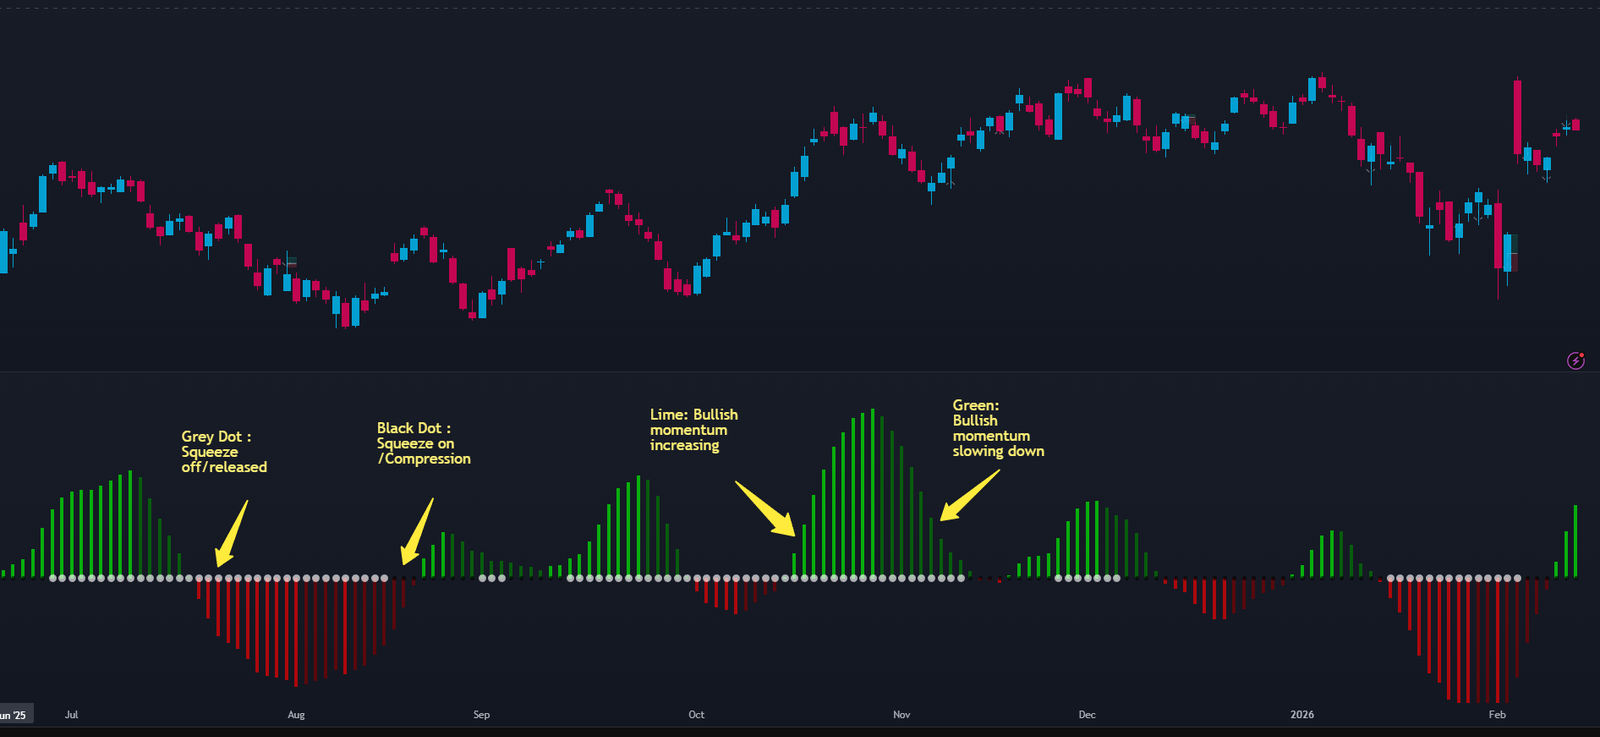
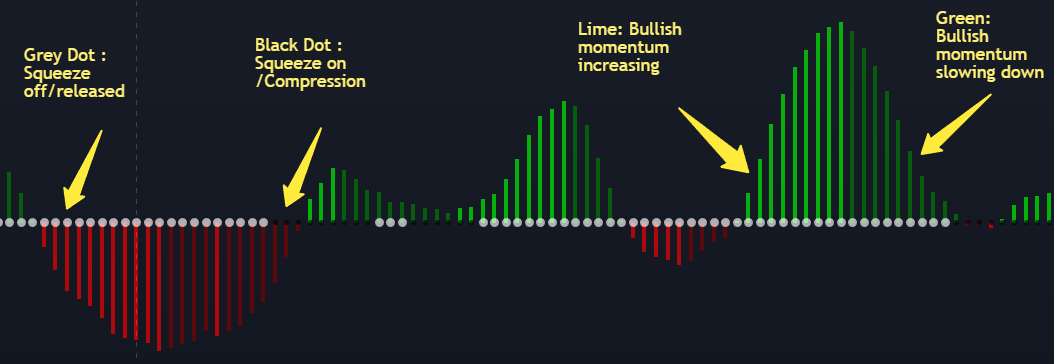
On charts, this appears as dots on the zero line:
- Black dots → Squeeze ON (compression)
- Gray dots → Squeeze OFF (release)
- Blue dots → Neutral
But volatility alone isn’t enough. We also need direction. That’s where the momentum histogram comes in.
Momentum Calculation — The Hidden Engine
LazyBear didn’t just add a standard momentum oscillator.
Instead, he built a custom momentum baseline using:
- Highest high (lookback)
- Lowest low (lookback)
- SMA of close
- Averaging the midpoints twice
- Measuring price deviation from that equilibrium
- Applying linear regression smoothing
In simplified form:
Momentum = Linear Regression of
           (Close – Smoothed Midpoint)
This does two things:
- Filters noise
- Highlights directional bias during squeeze release
Histogram Interpretation
Color coding gives trade context:
So when squeeze releases, traders look at histogram direction to anticipate breakout bias.
Why Traders Love This Indicator
Because it answers three critical questions at once:
1️⃣ Is volatility compressed?
2️⃣ Has expansion begun?
3️⃣ In which direction is momentum building?
That combination makes it useful across styles:
- Intraday breakout traders
- Swing traders
- Options traders (volatility expansion)
- Even position traders on higher timeframes
Building It in Python
Let’s now translate this TradingView favorite into Python. We’ll keep it:
- Fully vectorized
- Indicator-accurate
- Faithful to LazyBear’s original logic
- Compatible with any instrument / timeframe
Step 1 — Import Libraries
Step 2 — Pull Market Data
symbol = "^NSEI"
interval = "1d"
period = "6mo"
df = yf.download(symbol, interval=interval, period=period)
df.dropna(inplace=True)
You can swap in:
- Stocks
- Indices
- Crypto proxies
- Any Yahoo-supported ticker
Step 3 — Bollinger Bands
Here’s an important nuance. LazyBear’s script uses the KC multiplier for BB deviation.
length = 20
multKC = 1.5

close = df['Close']

basis = close.rolling(length).mean()
dev = multKC * close.rolling(length).std()

upperBB = basis + dev
lowerBB = basis - dev
This detail is critical if you want TradingView parity.
Step 4 — Keltner Channels
high = df['High']
low = df['Low']

lengthKC = 20

ma = close.rolling(lengthKC).mean()

tr1 = high - low
tr2 = (high - close.shift()).abs()
tr3 = (low - close.shift()).abs()

tr = pd.concat([tr1, tr2, tr3], axis=1).max(axis=1)

rangema = tr.rolling(lengthKC).mean()

upperKC = ma + rangema * multKC
lowerKC = ma - rangema * multKC
Step 5 — Detect the Squeeze
sqzOn  = (lowerBB > lowerKC) & (upperBB < upperKC)
sqzOff = (lowerBB < lowerKC) & (upperBB > upperKC)
noSqz  = (~sqzOn) & (~sqzOff)
This gives us the compression state bar-by-bar.
Step 6 — Momentum Engine
highest_high = high.rolling(lengthKC).max()
lowest_low   = low.rolling(lengthKC).min()

mid1 = (highest_high + lowest_low) / 2
mid2 = (mid1 + close.rolling(lengthKC).mean()) / 2

momentum_source = close - mid2
Step 7 — Linear Regression Smoothing
def rolling_linreg(series, length):
    x = np.arange(length)

    def linreg_calc(y):
        if np.any(np.isnan(y)):
            return np.nan
        slope, intercept = np.polyfit(x, y, 1)
        return intercept + slope * (length - 1)

    return series.rolling(length).apply(linreg_calc, raw=True)

val = rolling_linreg(momentum_source, lengthKC)
This replicates TradingView’s linreg() output.
Final Output Structure
result = pd.DataFrame({
    "Close": close,
    "Momentum": val,
    "SqueezeOn": sqzOn,
    "SqueezeOff": sqzOff,
    "NoSqueeze": noSqz
})
From here you can:
- Plot histograms
- Build scanners
- Trigger alerts
- Feed signals into backtests
Practical Interpretation
Here’s how traders typically read it:
Phase 1 — Black dots (Squeeze On)
Market is coiling. No trade yet.
Phase 2 — First gray dot
Squeeze releases → watch closely.
Phase 3 — Histogram direction
Defines breakout bias.
Example:
- Gray dot + Lime bars → Bullish expansion
- Gray dot + Red bars → Bearish expansion
Full Python Code
# FabTrader Algorithmic Trading Platform
# ----------------------------------------
# Copyright (c) 2025 FabTrader
#
# LICENSE: PROPRIETARY SOFTWARE
# - This software is the exclusive property of FabTrader.
# - Unauthorized copying, modification, distribution, or use is strictly prohibited.
#
# CONTACT:
# - Website: https://fabtrader.in
# - Email: [email protected]
#
# Usage: Personal use only. Not for commercial redistribution.

"""
==========================================================
           Momentum Squeeze Python Indicator
==========================================================
"""

import yfinance as yf
import pandas as pd
import numpy as np
import matplotlib.pyplot as plt

pd.set_option("display.max_rows", None, "display.max_columns", None)

def momentum_squeeze(symbol, interval, period):

    length = 20  # BB Length
    lengthKC = 20  # KC Length
    multKC = 1.5  # KC MultFactor
    useTrueRange = True  # KC Range type

    # =========================
    # Download Data
    # =========================
    df = yf.download(symbol, interval=interval, period=period,
                     progress=False, multi_level_index=False)

    df.dropna(inplace=True)
    high = df['High']
    low = df['Low']
    close = df['Close']

    # =========================
    # --- Bollinger Bands ---
    # =========================
    basis = close.rolling(length).mean()
    dev = multKC * close.rolling(length).std()

    upperBB = basis + dev
    lowerBB = basis - dev

    # =========================
    # --- Keltner Channels ---
    # =========================
    ma = close.rolling(lengthKC).mean()

    # True Range
    tr1 = high - low
    tr2 = (high - close.shift()).abs()
    tr3 = (low - close.shift()).abs()

    tr = pd.concat([tr1, tr2, tr3], axis=1).max(axis=1)

    range_ = tr if useTrueRange else (high - low)

    rangema = range_.rolling(lengthKC).mean()

    upperKC = ma + rangema * multKC
    lowerKC = ma - rangema * multKC

    # =========================
    # --- Squeeze Conditions ---
    # =========================
    sqzOn = (lowerBB > lowerKC) & (upperBB < upperKC)
    sqzOff = (lowerBB < lowerKC) & (upperBB > upperKC)
    noSqz = (~sqzOn) & (~sqzOff)

    # =========================
    # --- Momentum Value ---
    # =========================

    # Highest / Lowest
    highest_high = high.rolling(lengthKC).max()
    lowest_low = low.rolling(lengthKC).min()

    # Midline calculation
    mid1 = (highest_high + lowest_low) / 2
    mid2 = (mid1 + close.rolling(lengthKC).mean()) / 2

    # Source deviation
    momentum_source = close - mid2


    # =========================
    # Linear Regression
    # =========================
    def rolling_linreg(series, length):
        """Replicates TradingView linreg(series, length, 0)"""

        x = np.arange(length)

        def linreg_calc(y):
            if np.any(np.isnan(y)):
                return np.nan

            slope, intercept = np.polyfit(x, y, 1)
            return intercept + slope * (length - 1)

        return series.rolling(length).apply(linreg_calc, raw=True)


    val = rolling_linreg(momentum_source, lengthKC)

    # =========================
    # Set Indicator Markers
    # =========================
    val_prev = val.shift(1).fillna(0)

    bcolor = np.where(
        val > 0,
        np.where(val > val_prev, "lime", "green"),
        np.where(val < val_prev, "red", "maroon")
    )

    scolor = np.where(
        noSqz, "blue",
        np.where(sqzOn, "black", "gray")
    )

    # =========================
    # Final Output
    # =========================
    result = pd.DataFrame({
        "Close": close,
        "Momentum": val,
        "SqueezeOn": sqzOn,
        "SqueezeOff": sqzOff,
        "NoSqueeze": noSqz,
        "HistColor": bcolor,
        "ZeroLineColor": scolor
    })
    result.dropna(inplace=True)
    return result

if __name__ == "__main__":

    show_plot = True
    symbol = "^NSEI"  # Any instrument
    interval = "1d"  # Any timeframe: 1m,5m,1h,1d etc.
    period = "6mo"  # Data lookback

    result = momentum_squeeze(symbol, interval, period)
    print(result)

    if show_plot:

        plt.figure(figsize=(14,6))

        # Histogram
        colors = result["HistColor"].map({
            "lime":"lime",
            "green":"green",
            "red":"red",
            "maroon":"maroon"
        })

        plt.bar(result.index, result["Momentum"], color=colors)

        # Zero line dots
        zero_colors = result["ZeroLineColor"].map({
            "blue":"blue",
            "black":"black",
            "gray":"gray"
        })

        plt.scatter(result.index, [0]*len(result), color=zero_colors, s=10)

        plt.title(f"Squeeze Momentum — {symbol}")
        plt.show()
Why Code It Yourself?
TradingView is great for visualization. But Python unlocks:
- Strategy backtesting
- Portfolio scans
- Multi-asset screening
- Automation
- Integration into algo frameworks
And that’s where things get interesting…
What’s Coming in Part 2
In the next article, we’ll move from indicator to execution.
We’ll build and test:
- A complete squeeze breakout strategy
- Entry & exit logic
- Stop placement frameworks
- Intraday vs swing variations
- Backtest performance metrics
Essentially answering:
Does the squeeze actually deliver tradable edge?
Closing Thoughts
The Momentum Squeeze isn’t magical. It won’t predict breakouts. But it does something extremely valuable: It tells you when the market is quiet enough that a big move becomes statistically more likely. And in trading, timing volatility expansion can often matter more than predicting direction.
In Part 2, we’ll put that idea to the test — with rules, code, and data. Stay tuned.
If you’re building this into your own trading stack, scanners, or backtesting engines — I’d love to hear how you’re using it. The best edges often come from shared ideas, not isolated ones.
More from Python
Finding the Most Liquid Equity ETFs in each Category using Python
Not all ETFs are created equal — especially when it comes to liquidity. While NSE provides a full ETF list, identifying the...
Price Consolidation Boxes: Ranges, Breakouts, and Retests Using Python
Markets don’t trend most of the time — they pause, compress, and consolidate. Before every meaningful move up or down, price typically...
Learn Web Scraping with Python – A Practical Guide for Traders
Web scraping is an essential skill for traders and Python developers who want full control over their market data. In this practical...