Python
Price Consolidation Boxes: Ranges, Breakouts, and Retests Using Python

FabTrader
Article overview
Markets don’t trend most of the time — they pause, compress, and consolidate. Before every meaningful move up or down, price typically spends weeks locked inside a tight range where volatility contracts and both buyers and sellers reach a temporary balance. This article introduces a rule-based price consolidation box framework that objectively identifies these ranges, tracks their evolution, and detects breakouts, breakdowns, and post-breakout retests using pure price and volatility. Unlike subjective chart patterns or classical Darvas Boxes, this approach relies on clearly defined rules that make it suitable for screeners, backtests, and automated analysis. Using a practical Python implementation, we walk through how consolidation ranges are formed, validated, extended, and finally resolved — helping you spot high-quality expansion opportunities before the crowd reacts.
Markets spend far more time moving sideways than trending. Before every strong trend, there is usually a phase where price:
- compresses into a tight range
- absorbs supply and demand
- prepares for a directional expansion
This article explains a rule-based method to identify such price consolidation boxes, track their evolution, and detect:
- Breakouts / Breakdowns
- False moves
- Support–Resistance retests after breakout
We’ll also walk through a fully working Python implementation that you can use for:
- screeners
- backtests
- dashboards
- alerts
1️⃣ What is a Price Consolidation Box?
A price consolidation box is a well-defined price range where:
- Price oscillates between a clear high and low
- Volatility contracts
- Neither buyers nor sellers dominate decisively
Visually, this looks like price being “boxed in” between two horizontal levels.
Key characteristics of a valid consolidation:
- Multiple candles respect the same high and low
- The range does not expand aggressively
- Volatility remains contained
- Breakout happens on a closing basis
This is not the classical Darvas Box — instead, it is a practical, rule-driven consolidation range suitable for systematic trading and screening.
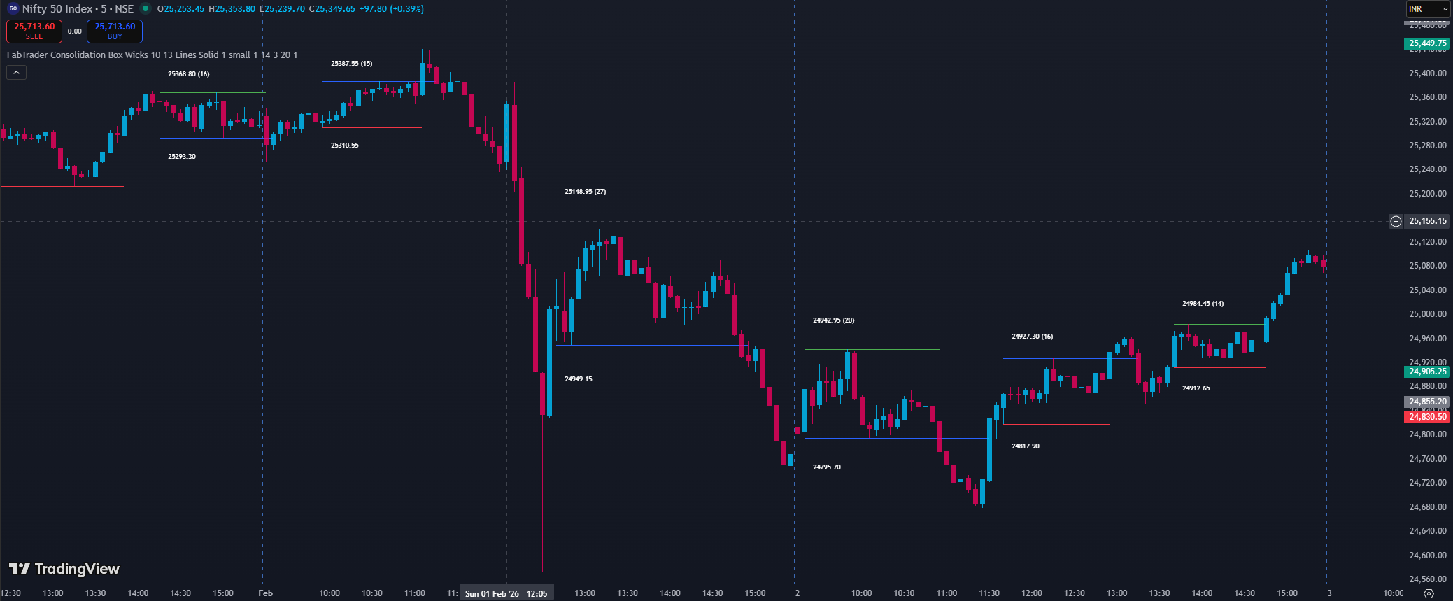
How to access the corresponding indicator on TradingView?
Search for 'Darvas Lines/Box' indicator on TradingView and you will find it.
2️⃣ Core Idea Behind the Algorithm
The logic is built as a state machine that processes price candle-by-candle.
At any point, the system is in one of four phases:
This ensures:
- One box at a time
- No repainting
- Clean lifecycle for each consolidation
3️⃣ Step-by-Step: How the Consolidation Box is Identified
🔹 Step 1: Define the Initial Range
For every new candle, the algorithm looks back at the last N candles (default: 10) and computes:
- Highest high
- Lowest low
You can choose whether these levels come from:
- Wicks (High / Low)
- Candle body (Open / Close)
Range High = max(highs over last N bars)
Range Low  = min(lows over last N bars)
🔹 Step 2: Validate the Range Using Volatility (ATR Filter)
Not all ranges are meaningful.
To filter out wide, noisy ranges, we compare the box height with volatility:
Box Height ≤ ATR × Max MultiplierThis ensures:
- The range is tight
- Price is genuinely consolidating
- Breakouts are meaningful
🔹 Step 3: Allow Range Extension (Before Breakout)
Markets are rarely perfect.
Before a breakout happens, price may:
- slightly push the high
- slightly dip the low
Instead of discarding the box immediately, the algorithm:
- extends the range if a new extreme appears
- keeps monitoring as long as no breakout occurs
This makes the box adaptive but disciplined.
4️⃣ Breakout & Breakdown Detection
A breakout is confirmed only when price closes outside the range.
- Bullish Breakout:
Close > Range High - Bearish Breakdown:
Close < Range Low
Wick-based moves are ignored — this avoids many false signals.
Once a breakout occurs:
- The box is finalized
- The breakout direction is recorded
- The system enters a cooldown phase
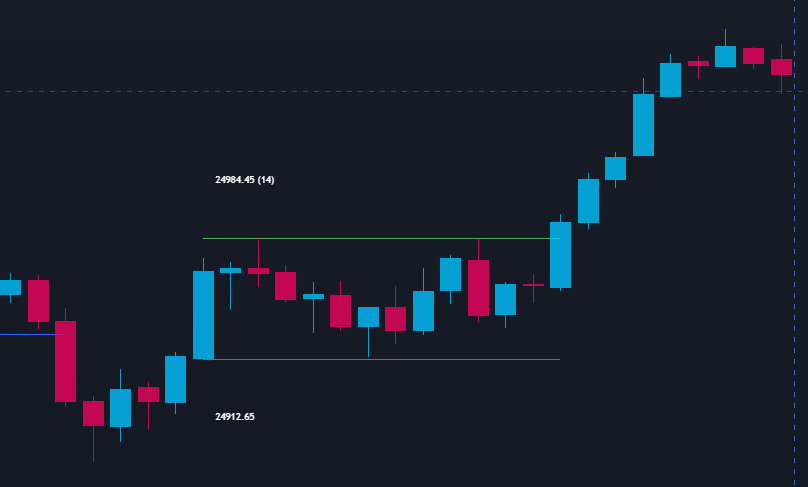
5️⃣ Retest Logic (Post-Breakout Validation)
Strong breakouts often retest the broken level before continuing.
This system checks:
- A fixed number of candles after breakout (default: 20)
- Whether price comes close to the breakout level
- Without violating it decisively
Retest rules:
- For bullish breakouts:
- Price dips near former resistance (now support)
- For bearish breakdowns:
- Price rallies near former support (now resistance)
A configurable percentage gap defines how close price must come to count as a retest.
This helps distinguish:
- strong breakouts
- weak or failed breakouts
6️⃣ Cooldown Phase: Avoiding Overlapping Boxes
After a breakout:
- The system waits for a fixed number of candles (default: 13)
- No new box is allowed during this period
This prevents:
- overlapping consolidations
- cluttered signals
- overtrading
Once the cooldown ends, the system resets and looks for the next consolidation.
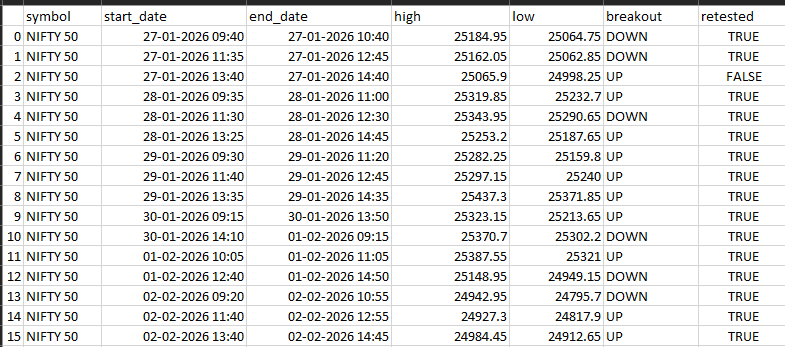
7️⃣ What the Python Code Produces
Instead of drawing chart objects, the Python implementation outputs structured data:
Each detected consolidation produces:
Start Date
End Date
Range High
Range Low
Breakout Direction (UP / DOWN)
Retest Confirmed (True / False)
This design makes the system:
- backtest-friendly
- scanner-ready
- easy to integrate with alerts or dashboards
8️⃣ Why This Works Well in Real Markets
This approach works because it aligns with market structure:
- Consolidation = balance
- Breakout = imbalance
- Retest = acceptance or rejection
It avoids:
- indicator noise
- subjective pattern drawing
- hindsight bias
And focuses purely on:
- price
- volatility
- structure
9️⃣ Full Python Implementation
Below is the complete Python implementation used to detect these consolidation boxes:
# -------------------------------------------------------------------------
#              FabTrader Algorithmic Trading - Tutorials
# -------------------------------------------------------------------------
# CONTACT:
# - Website: https://fabtrader.in
# - Email: [email protected]
#
# Usage: Educational Purposes & training use only. Not for commercial redistribution.
# ------------------------------------------------------------------------

import pandas as pd
from datetime import date, timedelta


def get_historical_data(symbol, start_date, end_date, interval):
    """
    Placeholder function. Replace this with your function to supply
    historical candle stick data
    Must return a Pandas DataFrame with:
    index  : Date (datetime)
    columns: Open, High, Low, Close, Volume
    """
    raise NotImplementedError


def calculate_atr(df, length=14):
    high = df['High']
    low = df['Low']
    close = df['Close']

    prev_close = close.shift(1)

    tr = pd.concat([
        high - low,
        (high - prev_close).abs(),
        (low - prev_close).abs()
    ], axis=1).max(axis=1)

    atr = tr.rolling(length).mean()
    return atr


def darvas_box(
    symbol,
    start_date,
    end_date,
    interval="1W",
    range_len=10,
    cooldown_bars=13,
    atr_len=14,
    max_atr_mult=3.0,
    retest_bars=20,
    retest_max_gap_pct=1.0,
    line_source="WICKS"  # or "BODY"
):
    df = get_historical_data(symbol, start_date, end_date, interval)
    df = df.copy()

    # Source high / low
    if line_source == "BODY":
        df['SourceHigh'] = df[['Open', 'Close']].max(axis=1)
        df['SourceLow'] = df[['Open', 'Close']].min(axis=1)
    else:
        df['SourceHigh'] = df['High']
        df['SourceLow'] = df['Low']

    df['ATR'] = calculate_atr(df, atr_len)

    results = []

    phase = 0
    armed_start_idx = None
    cooldown_start_idx = None

    range_high = None
    range_low = None
    final_high = None
    final_low = None

    breakout_up = False
    breakout_down = False
    is_retested = False

    for i in range(len(df)):
        row = df.iloc[i]

        # =========================
        # PHASE 0 — Define Range
        # =========================
        if phase == 0 and i >= range_len:
            window = df.iloc[i - range_len:i]

            hh = window['SourceHigh'].max()
            ll = window['SourceLow'].min()

            box_height = hh - ll
            atr_val = row['ATR']

            if pd.notna(atr_val) and box_height <= atr_val * max_atr_mult:
                range_high = hh
                range_low = ll
                final_high = hh
                final_low = ll
                armed_start_idx = i - range_len
                phase = 1
                phase0_idx = i

        # =========================
        # PHASE 1 — Wait 1 bar
        # =========================
        elif phase == 1 and i > phase0_idx:
            phase = 2

        # =========================
        # PHASE 2 — Breakout or Extend
        # =========================
        elif phase == 2:
            close = row['Close']

            breakout_up = close > range_high
            breakout_down = close < range_low

            if breakout_up or breakout_down:
                # Breakout confirmed
                cooldown_start_idx = i
                phase = 3
                is_retested = False

                results.append({
                    "symbol": symbol,
                    "start_date": df.index[armed_start_idx],
                    "end_date": df.index[i],
                    "high": final_high,
                    "low": final_low,
                    "breakout": "UP" if breakout_up else "DOWN",
                    "retested": False
                })

            else:
                # Extend range if needed
                if row['SourceHigh'] > range_high:
                    range_high = row['SourceHigh']
                    final_high = range_high

                if row['SourceLow'] < range_low:
                    range_low = row['SourceLow']
                    final_low = range_low

        # =========================
        # PHASE 3 — Cooldown + Retest
        # =========================
        elif phase == 3:
            lookback = i - cooldown_start_idx

            if not is_retested and lookback > 0:
                safe_lb = min(retest_bars, lookback)
                recent = df.iloc[i - safe_lb:i]

                breakout_price = range_high if breakout_up else range_low
                gap = breakout_price * retest_max_gap_pct / 100

                if breakout_up:
                    lowest = recent['Low'].min()
                    if breakout_price - gap <= lowest < breakout_price:
                        is_retested = True
                        results[-1]["retested"] = True

                if breakout_down:
                    highest = recent['High'].max()
                    if breakout_price < highest <= breakout_price + gap:
                        is_retested = True
                        results[-1]["retested"] = True

            if lookback >= cooldown_bars:
                phase = 0

    return pd.DataFrame(results)

if __name__ == '__main__':

    pd.set_option("display.max_rows", None, "display.max_columns", None)

    end_date = date.today()
    start_date =  end_date - timedelta(days=7)

    boxes = darvas_box(
        symbol="NIFTY 50",
        start_date=start_date,
        end_date=end_date,
        interval="5minute"
    )

    print(boxes)
    # Save results to a csv file
    boxes.to_csv("ConsolidationBox.csv")
Practical Applications
There are a number of ways this indicator could be used in a strategy (both intraday or swing). As continuation to this article, I plan to publish another one in future containing one of my personal strategies that is based on this indicator and its backtest results.
Final Thoughts
This consolidation box framework can be used as:
- a standalone breakout strategy
- a market structure filter
- a pre-condition for trend-following systems
The real edge comes not from predicting breakouts, but from:
- waiting patiently
- defining structure objectively
- reacting only when price proves itself
If you use this logic in your own tools or experiments, feel free to adapt the parameters to your market, timeframe, and trading style.
More from Python
Finding the Most Liquid Equity ETFs in each Category using Python
Not all ETFs are created equal — especially when it comes to liquidity. While NSE provides a full ETF list, identifying the...
The Market’s Coiled Spring — Building the Momentum Squeeze Indicator in Python
Volatility doesn’t expand randomly — it contracts first. The Momentum Squeeze Indicator, popularized by LazyBear, is built on this simple but powerful...
Learn Web Scraping with Python – A Practical Guide for Traders
Web scraping is an essential skill for traders and Python developers who want full control over their market data. In this practical...