
The Queue-Hopper’s Dilemma: A Lesson for Every Trader
Imagine this: You’re at a crowded bank or railway ticket counter. Two queues stretch long. You pick one. A few minutes pass — and the queue beside you seems to move faster. You hesitate, then decide to switch. Just as you join the new line, it slows down. Meanwhile, your original queue suddenly picks up speed.
Frustrated, you jump back. But the cycle repeats. Every switch sets you further behind.

This may sound like a mundane real-life situation — but it’s a perfect metaphor for how many retail traders behave in the markets. Jumping from one stock to another, from equity to gold to real estate, constantly chasing recent winners. Lacking a system, they end up buying tops and selling bottoms, missing the bigger picture.
What they lack is not luck — but perspective. A reliable way to see where true performance is emerging, and where capital is quietly exiting.
That’s where the Ratio Charting Technique comes in.
What is Ratio Charting?
Ratio Charting is a simple yet powerful technique where you divide the price of one asset (say, a stock or sector index) by another (typically a benchmark index like Nifty 50 or S&P 500). The result is a price ratio line plotted over time, which reveals how one asset is performing relative to the other.
Why This Ratio Matters
Absolute price charts only tell you if an asset is going up or down. But Ratio Charts tell you how it’s doing compared to the rest of the market.
This has profound implications:
- It reveals early signs of leadership before the crowd catches on.
- It helps identify when sectors or stocks are rotating in or out of favor.
- It acts as a market X-ray, showing underlying strength or weakness not visible in price alone.
This is why professional traders and fund managers closely watch price ratios — because in a capital-constrained world, outperformance is everything.
Understanding Cycles Through Ratios
Markets move in cycles — not just in prices, but also in sector performance and style rotations (like largecaps vs smallcaps, value vs growth). The Ratio Charting Technique can be a powerful tool to:
- Spot sector rotation before it becomes obvious
- Understand which part of the economic cycle we’re in
- Rotate capital into rising stars and avoid lagging segments
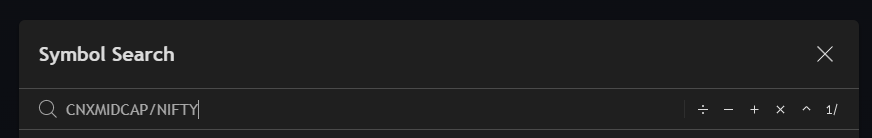
How to Build a Ratio Chart
The best way to do this is to use Tradingview.
Step 1: Input the asset you would like to track divided by the other asset (Benchmark) that you would like to compare against.
Step 2: Use a monthly timeframe and mark the visible high and low ranges.
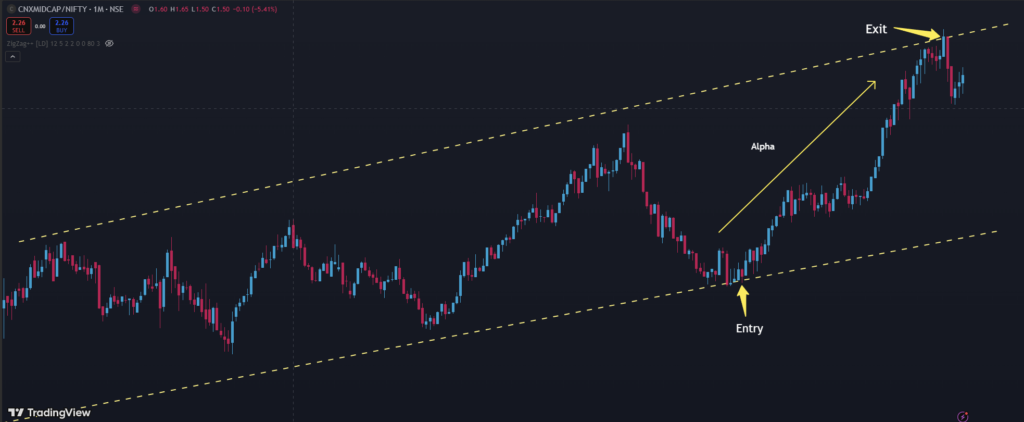
This chart is now ready to show you the exact time to enter and exit positions for the asset chosen. This indicative chart for Midcap clearly illustrates the cyclical nature of the price movement of this index against the NIFTY 50 benchmark. Catching this trend early and exiting when the trend matures gives the best possible outcome for any investor.
- Rising Ratio indicates Asset A is outperforming Asset B
- Falling Ratio indicates Asset A is underperforming
This not only minimizes drawdown of a portfolio but immensely maximizes the return on investment.
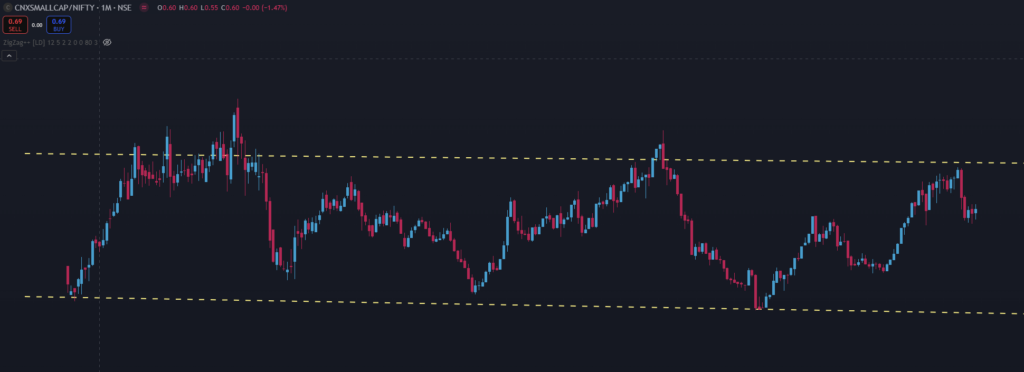
Following is one more example and this time, we have Small Cap index (CNXSMALLCAP) and NIFTY 50 being compared and this too clearly marks the critical points of entry and exit!
Final Thoughts
The Ratio Charting Technique adds a new dimension to market analysis. It strips away the noise of absolute performance and focuses on what really matters — relative dominance.
In a world where capital flows to leaders and exits laggards, understanding and leveraging ratio charts can transform your edge. Whether you’re a discretionary trader, long-term investor, or a quant building factor models, this technique deserves a place in your toolkit.
Support this community : FabTrader.in is a one-person initiative dedicated to helping individuals on their F.I.R.E. journey. Running and maintaining this community takes time, effort, and resources. If you’ve found value in the content, consider making a donation to support this mission.
Disclaimer: The information provided in this article is for educational and informational purposes only and should not be construed as financial, investment, or legal advice. The content is based on publicly available information and personal opinions and may not be suitable for all investors. Investing involves risks, including the loss of principal. Always conduct your own research and consult a qualified financial advisor before making any investment decisions. The author and website assume no liability for any financial losses or decisions made based on the information presented.
Vivek is an algorithmic trader, Python programmer, and a passionate advocate of the F.I.R.E. (Financial Independence, Retire Early) movement. He achieved his financial independence at the age of 45 and is dedicated to helping others embark on their own journeys toward financial freedom.