
Introduction
Support and resistance levels are crucial for traders as they help identify key price zones where reversals or continuations are likely to occur. The Dynamic Support and Resistance indicator, originally developed by LonesomeTheBlue in Pine Script on TradingView, automates the process of detecting these levels. This indicator is one of the most used and most loved indicator by Traders. This indicator gets its following due to its simplicity and accuracy!
In this article, I will explain how I converted this TradingView indicator into Python and how it can be used to enhance automated trading strategies.
How the Original Indicator Works
The Dynamic Support and Resistance indicator operates using Pivot Points to create price channels. The core functionality is as follows:
- Finding Pivot Points: The indicator identifies pivot highs and pivot lows based on recent price action.
- Creating Channels: Each pivot point forms a channel. The channel size is determined using the formula:
- Counting Pivot Points in Each Channel: The number of pivot points within each channel is counted. Channels with more pivot points are considered stronger support or resistance levels.
- Filtering Strong Levels: A threshold for Support/Resistance strength (S/R Strength) is applied. A channel must have at least this many pivot points to qualify as a valid support or resistance level.
- Priority to Recent Pivot Points: The indicator prioritizes recent pivot points, as they are more relevant in current market conditions.
- Plotting Support and Resistance Lines: Once the support and resistance zones are identified, the indicator visually represents them as horizontal lines.
The default loopback period is 300 candles, ensuring that recent pivot points are given priority over older ones.
Why This Indicator is Useful
Many traders face the problem of unknowingly placing trades too close to major support or resistance levels. This can lead to:
- Entering a long trade near resistance, only to see price reverse and hit stop loss.
- Entering a short trade near support, resulting in a price bounce and a stop-out.
Using this indicator in trading strategies helps avoid such situations by providing clear key support and resistance zones.
Converting the Indicator to Python
I converted this TradingView indicator into Python so that it can be integrated into automated trading strategies. Below is its python implementation:
"""
------------------------------------------------------------------------------------
FabTrader Algo Trading
------------------------------------------------------------------------------------
This is the python version of the Dynamic Support and Resistance Indicator
in TradingView (by LonesomeTheBlue)
Copyright (c) 2024 FabTrader
LICENSE: PROPRIETARY SOFTWARE
- This software is the exclusive property of FabTrader.
- Unauthorized distribution, or commercial use is prohibited.
CONTACT:
- Website: https://fabtrader.in
- Email: hello@fabtrader.in
Input:
1. Symbol
2. Timeframe
Output
1. Dynamic Support and Resistance levels
-- Dependencies to be installed --
pip install numpy
pip install pandas
Disclaimer:
The information provided is for educational and informational purposes only and
should not be construed as financial, investment, or legal advice. The content is based on publicly available
information and personal opinions and may not be suitable for all investors. Investing involves risks,
including the loss of principal.
"""
import pandas as pd
import numpy as np
import BrokerConnector
from Symbol_master import Instruments
from datetime import date, timedelta
def getDynamicSRLevels(symbol, timeframe):
def pivothigh(n, left_period, right_period):
ishigh = True
if n < left_period + right_period + 1:
ishigh = False
else:
musthighest = dfLB['High'][n - right_period]
for bar_index in range(n - left_period - right_period, n + 1):
if (dfLB['High'][bar_index] >= musthighest and bar_index != n - right_period):
ishigh = False
if (ishigh):
return musthighest
return None
def pivotlow(n, left_period, right_period):
islow = True
if n < left_period + right_period + 1:
islow = False
else:
mustlowest = dfLB['Low'][n - right_period]
for bar_index in range(n - left_period - right_period, n + 1):
if (dfLB['Low'][bar_index] <= mustlowest and bar_index != n - right_period):
islow = False
if (islow):
return mustlowest
return None
def highest(n, back):
value = None
for bar_index in range(n - back + 1, n + 1):
if bar_index < 0:
continue
if value is None or dfLB['High'][bar_index] > value:
value = dfLB['High'][bar_index]
return value
def lowest(n, back):
value = None
for bar_index in range(n - back + 1, n + 1):
if bar_index < 0:
continue
if value is None or dfLB['Low'][bar_index] < value:
value = dfLB['Low'][bar_index]
return value
# return value
def prev_value(col, n, back):
value = 0
if n < back + 1:
value = 0
else:
value = value = dfLB[col][n - back]
return value
# Initialize
rb = 10 # "Period for Pivot Points"
prd = 284 # "Loopback Period"
nump = 2 # "S/R strength"
ChannelW = 10 # "Channel Width %"
finalList = []
offset = 365
pd.options.mode.chained_assignment = None # default='warn'
# Extract historic data
if timeframe == 'day':
offset = 364
elif timeframe == '5':
offset = 4
elif timeframe == '15':
offset = 16
elif timeframe == '60':
offset = 55
else:
print('Not a valid timeframe')
offset = 4
begin = date.today() - timedelta(days=offset)
end = date.today()
#---------- Replace this code below with your own code to fetch historic data-----#
dfLB = Instruments.get_historical_data(symbol, begin, end, timeframe)
#---------- Replace this code below with your own code to fetch historic data-----#
dfLB = dfLB.tail(284)
dfLB.reset_index(inplace=True)
dfLB.columns = ['Date', 'Open', 'High', 'Low', 'Close', 'Volume']
if not dfLB.empty:
dfLB["ph"] = None
dfLB["pl"] = None
dfLB["u1"] = 0.0
dfLB["d1"] = 0.0
dfLB["highestph"] = 0.0
dfLB["lowestpl"] = 0.0
sr_levels = [None] * 21
totallen = len(dfLB.index)
prdlowest = 0
prdhighest = 0
for n, row in dfLB.iterrows():
ph = pivothigh(n, rb, rb)
pl = pivotlow(n, rb, rb)
dfLB.iloc[n, dfLB.columns.get_loc('ph')] = ph
dfLB.iloc[n, dfLB.columns.get_loc('pl')] = pl
prdhighest = highest(n, prd)
prdlowest = lowest(n, prd)
cwidth = (prdhighest - prdlowest) * ChannelW / 100
dfLB.iloc[n, dfLB.columns.get_loc("u1")] = prev_value("u1", n, 1)
dfLB.iloc[n, dfLB.columns.get_loc("d1")] = prev_value("d1", n, 1)
dfLB.iloc[n, dfLB.columns.get_loc("highestph")] = prev_value("highestph", n, 1)
dfLB.iloc[n, dfLB.columns.get_loc("lowestpl")] = prev_value("lowestpl", n, 1)
if ph is not None or pl is not None:
for x in range(len(sr_levels)):
sr_levels[x] = None
aas = [True] * 41
dfLB.iloc[n, dfLB.columns.get_loc("highestph")] = prdlowest
dfLB.iloc[n, dfLB.columns.get_loc("lowestpl")] = prdhighest
countpp = 0 # // keep position of the PP
for x in range(0, prd + 1):
if n < x + rb:
break
if dfLB["ph"][n - x] is not None or dfLB["pl"][n - x] is not None:
countpp = countpp + 1
if countpp > 40:
break
if aas[countpp]: # array.get(aas, countpp) // if PP is not used in a channel
upl = (dfLB['High'][n - x - rb] if dfLB["ph"][n - x] is not None else dfLB['Low'][
n - (x + rb)]) + cwidth
dnl = (dfLB['High'][n - x - rb] if dfLB["ph"][n - x] is not None else dfLB['Low'][
n - (x + rb)]) - cwidth
tmp = [True] * 41
cnt = 0
tpoint = 0
for xx in range(0, prd + 1):
if n < xx + rb:
break
if dfLB["ph"][n - xx] is not None or dfLB["pl"][n - xx] is not None:
chg = False
cnt = cnt + 1
if cnt > 40:
break
if aas[cnt]: # // if PP not used in other channels
if dfLB["ph"][n - xx] is not None: # not na(ph[xx])
if dfLB['High'][n - xx - rb] <= upl and dfLB['High'][
n - xx - rb] >= dnl: # // PP is in the channel?
tpoint = tpoint + 1
chg = True
if dfLB["pl"][n - xx] is not None:
if dfLB['Low'][n - xx - rb] <= upl and dfLB['Low'][
n - xx - rb] >= dnl: # // PP is in the channel?
tpoint = tpoint + 1
chg = True
if chg and cnt < 41:
tmp[cnt] = False
if tpoint >= nump: # // met enough PP in the channel? mark the PP as used for a channel and set the SR level
for g in range(41):
if not tmp[g]:
aas[g] = False
if dfLB["ph"][n - x] is not None and countpp < 21:
sr_levels[countpp] = dfLB['High'][n - x - rb]
if dfLB["pl"][n - x] is not None and countpp < 21:
sr_levels[countpp] = dfLB['Low'][n - x - rb]
finalList = sr_levels
finalList.append(prdlowest)
finalList.append(prdhighest)
finalList = [item for item in sr_levels if item is not None]
finalList = np.unique(finalList).tolist()
finalList.sort()
return finalList
else:
print("No data Supplied. Quitting")
return finalList
if __name__ == "__main__":
# Generate Dynamic Support and Resistance
symbol = "INFY"
timeframe = 'day' # Valid timeframes day, 5minute, 15minute, 60minute
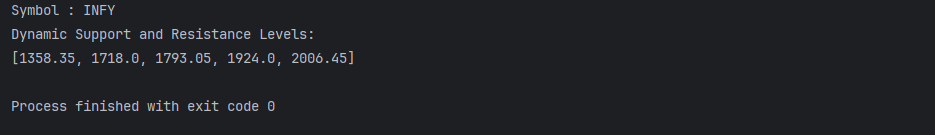
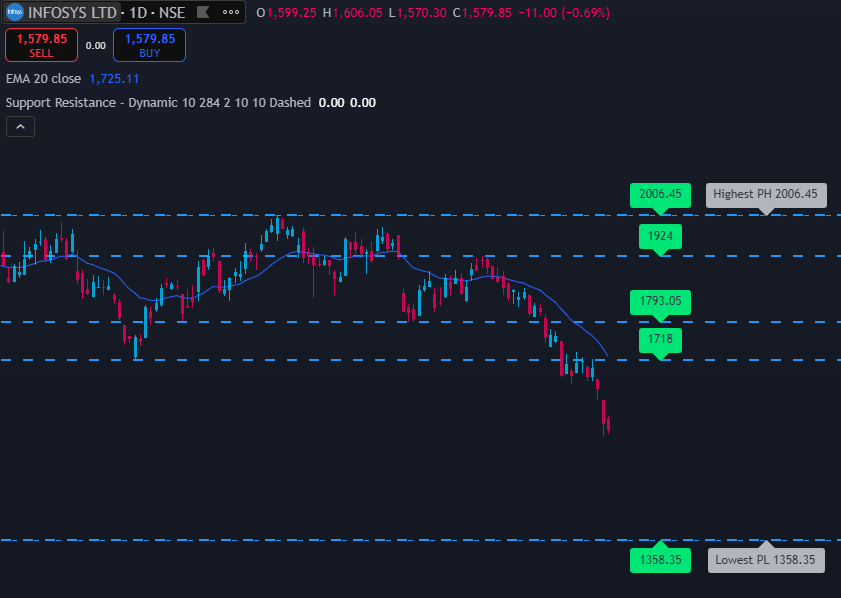
print("Symbol :", symbol)
print("Dynamic Support and Resistance Levels:")
print(getDynamicSRLevels(symbol, "day"))
Application in Algorithmic Trading
This Python implementation can be integrated into automated trading strategies to enhance decision-making.
How it Helps in Algo Trading
- Avoiding bad trade entries: Ensures that no buy trades are placed near resistance and no sell trades near support.
- Optimizing stop-loss levels: Traders can use support levels for setting stop-loss orders in long trades and resistance levels for short trades.
- Dynamic adjustments: Unlike static support/resistance levels, this indicator adapts to recent price action, making it more relevant.
Conclusion
By converting the Dynamic Support and Resistance indicator from Pine Script to Python, we unlock new possibilities for automated trading strategies. This approach ensures traders avoid common pitfalls of placing trades too close to significant price zones, leading to better trade execution and risk management.
If you are building an algo trading system, integrating this Python-based support and resistance detection can help you make data-driven trading decisions.
Support this community : FabTrader.in is a one-person initiative dedicated to helping individuals on their F.I.R.E. journey. Running and maintaining this community takes time, effort, and resources. If you’ve found value in the content, consider making a donation to support this mission.
Disclaimer: The information provided in this article is for educational and informational purposes only and should not be construed as financial, investment, or legal advice. The content is based on publicly available information and personal opinions and may not be suitable for all investors. Investing involves risks, including the loss of principal. Always conduct your own research and consult a qualified financial advisor before making any investment decisions. The author and website assume no liability for any financial losses or decisions made based on the information presented.
Vivek is an algorithmic trader, Python programmer, and a passionate advocate of the F.I.R.E. (Financial Independence, Retire Early) movement. He achieved his financial independence at the age of 45 and is dedicated to helping others embark on their own journeys toward financial freedom.